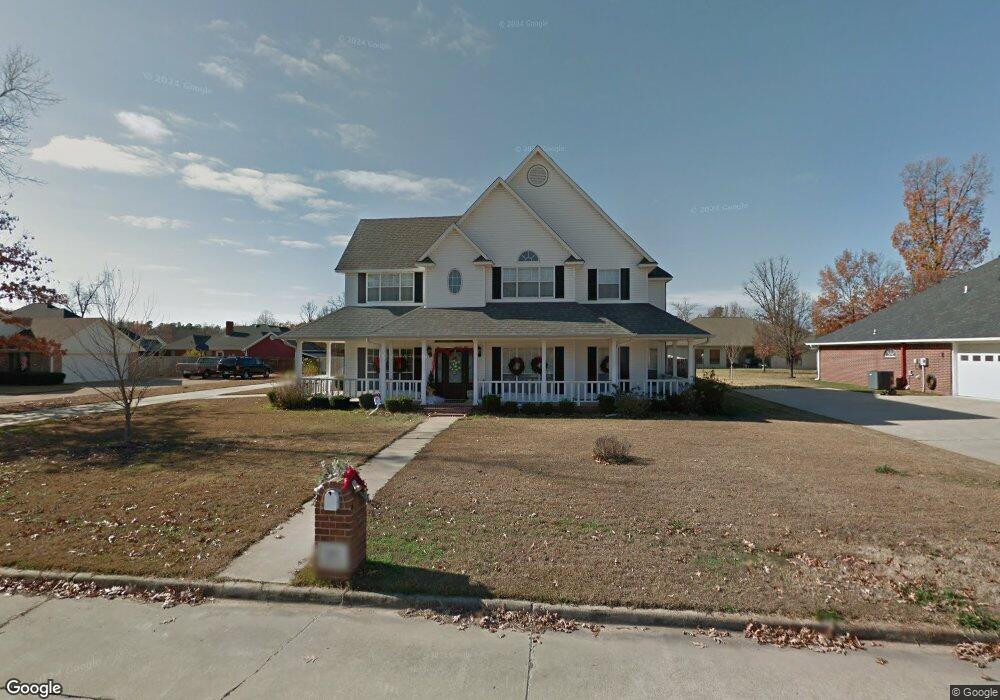
7005 Forest Oak Dr Texarkana, AR 71854
Estimated Value: $391,000 - $553,000
--
Bed
3
Baths
3,670
Sq Ft
$131/Sq Ft
Est. Value
About This Home
This home is located at 7005 Forest Oak Dr, Texarkana, AR 71854 and is currently estimated at $479,561, approximately $130 per square foot. 7005 Forest Oak Dr is a home located in Miller County with nearby schools including Arkansas High School, Trinity Christian School, and Veritas Academy.
Ownership History
Date
Name
Owned For
Owner Type
Purchase Details
Closed on
Apr 13, 2012
Sold by
Brown Madison C and Brown Zella S
Bought by
Chandler Jonathan Drew and Chandler Audrey M
Current Estimated Value
Home Financials for this Owner
Home Financials are based on the most recent Mortgage that was taken out on this home.
Original Mortgage
$284,614
Outstanding Balance
$195,736
Interest Rate
3.97%
Mortgage Type
Future Advance Clause Open End Mortgage
Estimated Equity
$283,825
Purchase Details
Closed on
Mar 28, 2000
Bought by
Brown Madison C and Brown Zella S
Purchase Details
Closed on
Feb 1, 1999
Bought by
Farr Richard Carter and Farr Jane A
Purchase Details
Closed on
May 2, 1995
Bought by
Lotz Charles A and Lotz Natalie C
Purchase Details
Closed on
Dec 13, 1994
Bought by
Lotz Charles A and Lotz Natalie C
Create a Home Valuation Report for This Property
The Home Valuation Report is an in-depth analysis detailing your home's value as well as a comparison with similar homes in the area
Home Values in the Area
Average Home Value in this Area
Purchase History
| Date | Buyer | Sale Price | Title Company |
|---|---|---|---|
| Chandler Jonathan Drew | $281,000 | Southwest Title Company | |
| Brown Madison C | $226,000 | -- | |
| Farr Richard Carter | $225,000 | -- | |
| Lotz Charles A | -- | -- | |
| Lotz Charles A | $20,000 | -- |
Source: Public Records
Mortgage History
| Date | Status | Borrower | Loan Amount |
|---|---|---|---|
| Open | Chandler Jonathan Drew | $284,614 |
Source: Public Records
Tax History Compared to Growth
Tax History
| Year | Tax Paid | Tax Assessment Tax Assessment Total Assessment is a certain percentage of the fair market value that is determined by local assessors to be the total taxable value of land and additions on the property. | Land | Improvement |
|---|---|---|---|---|
| 2025 | $3,489 | $72,550 | $9,680 | $62,870 |
| 2024 | $3,395 | $67,850 | $9,680 | $58,170 |
| 2023 | $3,300 | $67,850 | $9,680 | $58,170 |
| 2022 | $3,350 | $67,850 | $9,680 | $58,170 |
| 2021 | $3,272 | $67,850 | $9,680 | $58,170 |
| 2020 | $3,106 | $67,850 | $9,680 | $58,170 |
| 2019 | $2,940 | $60,390 | $9,680 | $50,710 |
| 2018 | $2,965 | $60,390 | $9,680 | $50,710 |
| 2017 | $2,967 | $60,410 | $9,680 | $50,730 |
| 2016 | $2,967 | $60,410 | $9,680 | $50,730 |
| 2015 | $2,967 | $60,410 | $9,680 | $50,730 |
| 2014 | -- | $58,370 | $9,680 | $48,690 |
Source: Public Records
Map
Nearby Homes
- 6902 Live Oak Dr
- TBD Arkansas 296
- 7102 Forest Oak Dr
- 7005 Tall Oaks
- 6923 Sugarland Dr
- 3410 Water Oak Dr
- 43 Sugar Ridge Ln
- 3910 Water Oak Dr
- 3910 Water Oak
- 6516 Wuthering Heights Ln
- 6904 Cherrybark Cir
- 22 Sugar Ridge Ln
- 3620 Northern Red Oak Trail
- 3517 Northern Red Oak Trail
- 7405 Johna Cir
- 6201 River Birch Way
- 6207 River Birch Way
- 000 Deer Run
- 6701 Northern Hills Dr
- 6912 Sugarhill Acres Dr
- 7009 Forest Oak Dr
- 7001 Forest Oak Dr
- 7006 Live Oak Dr
- 7002 Live Oak Dr
- 7010 Live Oak Dr
- 7006 Forest Oak Dr
- 7002 Forest Oak Dr
- 7010 Forest Oak Dr
- 7010 Forest Oak Dr Unit 23rd St
- 7101 Forest Oak Dr
- 6909 Forest Oak Dr
- 6910 Live Oak Dr
- 7102 Live Oak Dr
- 6910 Forest Oak Dr
- 7005 Live Oak Dr
- 7001 Live Oak Dr
- 7009 Live Oak Dr
- 7105 Forest Oak Dr
- 6905 Forest Oak Dr
- 7106 Live Oak Dr