Estimated Value: $175,000 - $239,000
3
Beds
2
Baths
1,250
Sq Ft
$167/Sq Ft
Est. Value
About This Home
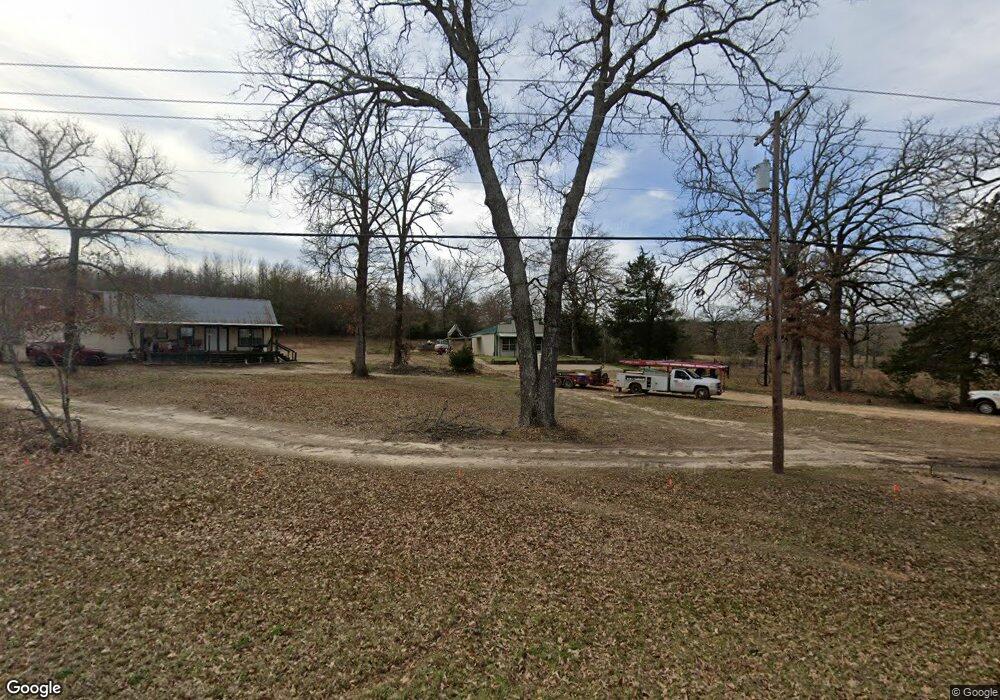
This home is located at 7006 County Road 219, Tyler, TX 75707 and is currently estimated at $209,114, approximately $167 per square foot. 7006 County Road 219 is a home with nearby schools including Kissam Intermediate School, Jackson Elementary School, and Chapel Hill Middle School.
Ownership History
Date
Name
Owned For
Owner Type
Purchase Details
Closed on
Sep 16, 2025
Sold by
Thayer Terisa and Glaspie Darren Lee
Bought by
Perez Luis Gerardo Galv and Ibarra Samantha Anai
Current Estimated Value
Purchase Details
Closed on
May 3, 2023
Sold by
Rb Investment Properties Llc
Bought by
Perez Luis Gerardo Galv and Ibarra Samantha Anai
Home Financials for this Owner
Home Financials are based on the most recent Mortgage that was taken out on this home.
Original Mortgage
$159,000
Interest Rate
6.42%
Mortgage Type
Seller Take Back
Purchase Details
Closed on
Jul 20, 2022
Sold by
Glaspie Villela Taylor D
Bought by
Rb Investment Properties Llc
Purchase Details
Closed on
Feb 4, 2013
Sold by
Glaspie Darren Lee
Bought by
Glaspie Villela Taylor D and Glaspie Tarayn L
Create a Home Valuation Report for This Property
The Home Valuation Report is an in-depth analysis detailing your home's value as well as a comparison with similar homes in the area
Home Values in the Area
Average Home Value in this Area
Purchase History
| Date | Buyer | Sale Price | Title Company |
|---|---|---|---|
| Perez Luis Gerardo Galv | -- | None Listed On Document | |
| Perez Luis Gerardo Galv | -- | None Listed On Document | |
| Rb Investment Properties Llc | -- | Richard H Hughes | |
| Glaspie Villela Taylor D | -- | None Available |
Source: Public Records
Mortgage History
| Date | Status | Borrower | Loan Amount |
|---|---|---|---|
| Previous Owner | Perez Luis Gerardo Galv | $159,000 |
Source: Public Records
Tax History Compared to Growth
Tax History
| Year | Tax Paid | Tax Assessment Tax Assessment Total Assessment is a certain percentage of the fair market value that is determined by local assessors to be the total taxable value of land and additions on the property. | Land | Improvement |
|---|---|---|---|---|
| 2025 | $1,531 | $151,077 | $24,983 | $126,094 |
| 2024 | $1,531 | $152,693 | $24,984 | $127,709 |
| 2023 | $748 | $43,780 | $18,488 | $25,292 |
| 2022 | $643 | $40,212 | $14,222 | $25,990 |
| 2021 | $696 | $40,873 | $14,222 | $26,651 |
| 2020 | $738 | $41,568 | $14,222 | $27,346 |
| 2019 | $783 | $42,266 | $14,222 | $28,044 |
| 2018 | $632 | $34,276 | $5,571 | $28,705 |
| 2017 | $648 | $34,939 | $5,571 | $29,368 |
| 2016 | $661 | $35,636 | $5,571 | $30,065 |
| 2015 | $681 | $35,982 | $5,571 | $30,411 |
| 2014 | $681 | $36,645 | $5,571 | $31,074 |
Source: Public Records
Map
Nearby Homes
- 8226 County Road 219
- 8217 County Road 219
- 10130 State Highway 64 E
- 10205 County Road 272
- 4024 Hanover Place
- 4037 Hanover Place
- 2527 Westminster Dr
- 00 County Road 2209
- 4029 Hanover Place
- 4025 Hanover Place
- 4021 Hanover Place
- 3962 Hanover Place
- 3950 Hanover Place
- 3913 Belle Mere St
- 2613 Chelsea Dr
- 2216 Gish Ln
- 10114 County Road 272
- 2033 Old Omen Rd
- 3205 Timberlane Dr
- 1835 Melba Dr
- 7010 County Road 219
- 6832 County Road 219
- 7845 County Road 219
- 10684 County Road 272
- 10642 County Road 272
- 6400 County Road 219
- 8031 County Road 219
- 10497 County Road 272
- 8111 County Road 219
- 8234 County Road 219
- 6325 County Road 219
- 6074 County Road 219
- 8205 County Road 219
- 5970 County Road 219
- 8371 County Road 219
- 5826 County Road 219
- 8225 County Road 219
- 8373 County Road 219
- 10588 State Highway 64 E
- 10588 State Highway 64 E