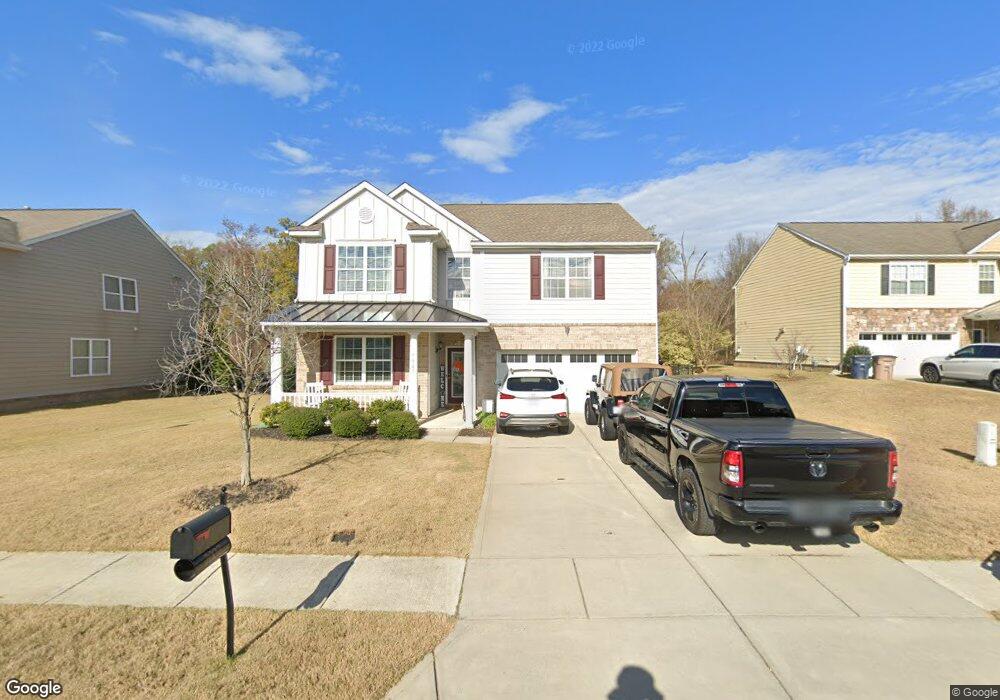
7007 Blue Stream Ln Unit FSF45 Indian Trail, NC 28079
Estimated Value: $459,219 - $503,000
4
Beds
3
Baths
2,673
Sq Ft
$178/Sq Ft
Est. Value
About This Home
This home is located at 7007 Blue Stream Ln Unit FSF45, Indian Trail, NC 28079 and is currently estimated at $476,055, approximately $178 per square foot. 7007 Blue Stream Ln Unit FSF45 is a home located in Union County with nearby schools including Poplin Elementary School, Porter Ridge Middle School, and Porter Ridge High School.
Ownership History
Date
Name
Owned For
Owner Type
Purchase Details
Closed on
Sep 21, 2017
Sold by
Spooner Ryan E and Spooner Amy E
Bought by
Aaron Jason P and Aaron Abby L
Current Estimated Value
Home Financials for this Owner
Home Financials are based on the most recent Mortgage that was taken out on this home.
Original Mortgage
$210,072
Outstanding Balance
$175,425
Interest Rate
3.9%
Mortgage Type
New Conventional
Estimated Equity
$300,630
Purchase Details
Closed on
Dec 17, 2014
Sold by
Funderburk Matthew Lee and Funderburk Emily Rose
Bought by
Spooner Ryan E and Spooner Amy E
Purchase Details
Closed on
Nov 21, 2008
Sold by
Centex Homes
Bought by
Funderburk Matthew Lee and Funderburk Emily Rose
Home Financials for this Owner
Home Financials are based on the most recent Mortgage that was taken out on this home.
Original Mortgage
$163,350
Interest Rate
5.89%
Mortgage Type
Unknown
Create a Home Valuation Report for This Property
The Home Valuation Report is an in-depth analysis detailing your home's value as well as a comparison with similar homes in the area
Home Values in the Area
Average Home Value in this Area
Purchase History
| Date | Buyer | Sale Price | Title Company |
|---|---|---|---|
| Aaron Jason P | $263,000 | None Available | |
| Spooner Ryan E | $220,000 | Barristers Title Svcs Of The | |
| Funderburk Matthew Lee | $181,500 | None Available |
Source: Public Records
Mortgage History
| Date | Status | Borrower | Loan Amount |
|---|---|---|---|
| Open | Aaron Jason P | $210,072 | |
| Previous Owner | Funderburk Matthew Lee | $163,350 |
Source: Public Records
Tax History Compared to Growth
Tax History
| Year | Tax Paid | Tax Assessment Tax Assessment Total Assessment is a certain percentage of the fair market value that is determined by local assessors to be the total taxable value of land and additions on the property. | Land | Improvement |
|---|---|---|---|---|
| 2024 | $2,459 | $291,900 | $54,000 | $237,900 |
| 2023 | $2,438 | $291,900 | $54,000 | $237,900 |
| 2022 | $2,438 | $291,900 | $54,000 | $237,900 |
| 2021 | $2,438 | $291,900 | $54,000 | $237,900 |
| 2020 | $1,532 | $196,500 | $34,000 | $162,500 |
| 2019 | $1,949 | $196,500 | $34,000 | $162,500 |
| 2018 | $1,532 | $196,500 | $34,000 | $162,500 |
| 2017 | $2,050 | $196,500 | $34,000 | $162,500 |
| 2016 | $2,007 | $196,500 | $34,000 | $162,500 |
| 2015 | $1,626 | $196,500 | $34,000 | $162,500 |
| 2014 | $1,613 | $225,800 | $37,500 | $188,300 |
Source: Public Records
Map
Nearby Homes
- 1007 Green Terra Rd
- 5003 Singletree Ln
- 1014 Garden Web Rd
- 1008 Wellscroft Rd
- 4023 Cunningham Farm Dr
- 4019 Cunningham Farm Dr
- 3021 Cunningham Farm Dr
- 1007 Farm Branch Rd
- 1003 Dairy Glen Rd
- 2017 Cunningham Farm Dr
- 1008 Farm Branch Rd
- 1001 Cunningham Farm Dr
- 1014 Puddle Pond Rd
- 3001 Cunningham Farm Dr
- 2021 Cunningham Farm Dr
- 2025 Cunningham Farm Dr
- Plan 2074 at Sheffield
- Plan 2177 at Sheffield
- Plan 2723 at Sheffield
- Plan 2338 Modeled at Sheffield
- 7007 Blue Stream Ln
- 7005 Blue Stream Ln
- 7009 Blue Stream Ln
- 7003 Blue Stream Ln
- 1025 Gwinmar Rd
- 8003 Blue Stream Ln
- 1024 Rural Farm Rd
- 6007 Blue Stream Ln
- 1023 Gwinmar Rd Unit 232
- 1023 Gwinmar Rd
- 1022 Rural Farm Rd
- 8005 Blue Stream Ln
- 1026 Gwinmar Rd Unit FS209
- 1026 Gwinmar Rd
- 1026 Gwinmar Rd
- 6005 Blue Stream Ln
- 6005 Blue Stream Ln Unit 49
- 1020 Rural Farm Rd
- 1023 Rural Farm Rd
- 1021 Gwinmar Rd