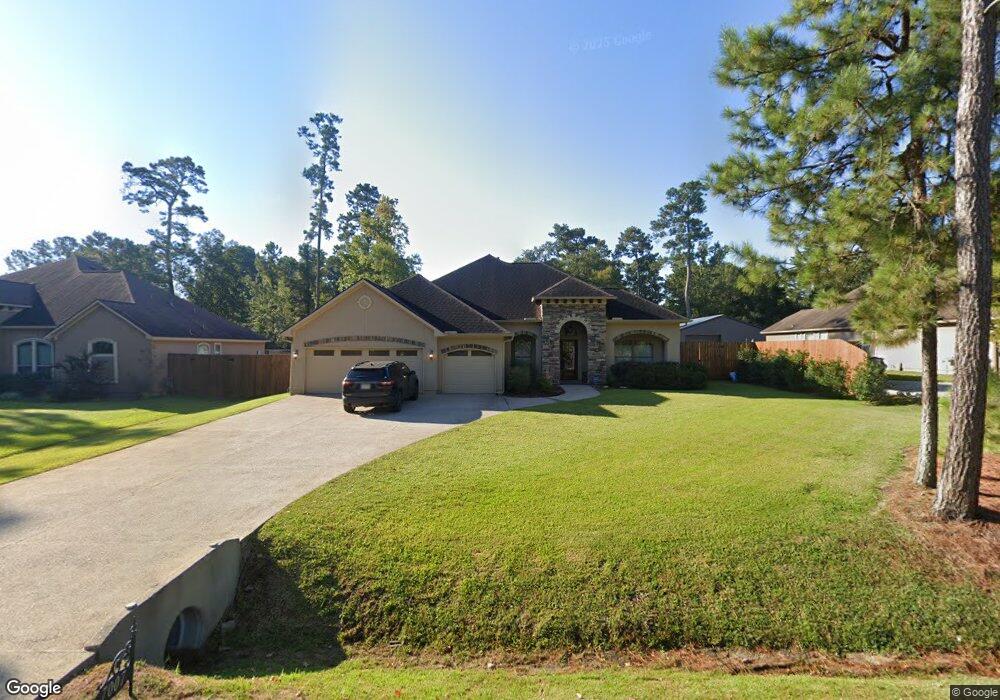
7007 Nickaburr Creek Dr Magnolia, TX 77354
Westwood NeighborhoodEstimated Value: $474,000 - $553,884
3
Beds
4
Baths
2,770
Sq Ft
$184/Sq Ft
Est. Value
About This Home
This home is located at 7007 Nickaburr Creek Dr, Magnolia, TX 77354 and is currently estimated at $510,221, approximately $184 per square foot. 7007 Nickaburr Creek Dr is a home located in Montgomery County with nearby schools including Bear Branch Elementary School, Bear Branch Junior High School, and Magnolia High School.
Ownership History
Date
Name
Owned For
Owner Type
Purchase Details
Closed on
Jul 21, 2016
Sold by
Neubaum Jon T and Neubaum Barbara A
Bought by
Reznick Kathi L and Reznick Christopher J
Current Estimated Value
Home Financials for this Owner
Home Financials are based on the most recent Mortgage that was taken out on this home.
Original Mortgage
$289,000
Outstanding Balance
$181,535
Interest Rate
3.56%
Mortgage Type
New Conventional
Estimated Equity
$328,686
Purchase Details
Closed on
Mar 8, 2016
Sold by
Alianza Group Inc
Bought by
Reznick Christopher J and Reznick Kathi L
Purchase Details
Closed on
Feb 9, 2015
Sold by
Egl Investments Llc
Bought by
Reznick Christopher J and Reznick Kathi L
Create a Home Valuation Report for This Property
The Home Valuation Report is an in-depth analysis detailing your home's value as well as a comparison with similar homes in the area
Home Values in the Area
Average Home Value in this Area
Purchase History
| Date | Buyer | Sale Price | Title Company |
|---|---|---|---|
| Reznick Kathi L | -- | Great American Title | |
| Reznick Christopher J | -- | -- | |
| Reznick Christopher J | -- | -- |
Source: Public Records
Mortgage History
| Date | Status | Borrower | Loan Amount |
|---|---|---|---|
| Open | Reznick Kathi L | $289,000 |
Source: Public Records
Tax History Compared to Growth
Tax History
| Year | Tax Paid | Tax Assessment Tax Assessment Total Assessment is a certain percentage of the fair market value that is determined by local assessors to be the total taxable value of land and additions on the property. | Land | Improvement |
|---|---|---|---|---|
| 2025 | $7,084 | $570,969 | $80,000 | $490,969 |
| 2024 | $6,336 | $540,254 | -- | -- |
| 2023 | $6,336 | $491,140 | $80,000 | $478,600 |
| 2022 | $7,879 | $446,490 | $66,690 | $448,130 |
| 2021 | $7,544 | $405,900 | $57,000 | $348,900 |
| 2020 | $7,795 | $385,180 | $57,000 | $328,180 |
| 2019 | $7,240 | $359,520 | $57,000 | $302,520 |
| 2018 | $6,749 | $353,440 | $22,400 | $331,040 |
| 2017 | $7,495 | $353,440 | $22,400 | $331,040 |
| 2016 | $7,495 | $353,440 | $22,400 | $331,040 |
| 2015 | $480 | $22,400 | $22,400 | $0 |
| 2014 | $480 | $22,400 | $22,400 | $0 |
Source: Public Records
Map
Nearby Homes
- 7115 Nickaburr Creek Dr
- 32726 Riverwood Dr
- 7215 Ramblewood Dr
- 7402 Nickaburr Creek Dr
- 33003 Westwood Square East Dr
- 7407 Nickaburr Creek Dr
- 42555 Rustico Rd
- 7407 Ramblewood Dr
- 7415 Charred Pine Dr
- 7507 Charred Pine Dr
- 33127 Cottonwood Bend
- 0 Magnolia Cir
- 7215 Autumn Day Ct
- 286 Brazen Forest Trail
- 298 Brazen Forest Trail
- 291 Brazen Forest Trail
- 294 Brazen Forest Trail
- 295 Brazen Forest Trail
- 282 Brazen Forest Trail
- 227 Brazen Forest Trail
- 7011 Nickaburr Creek Dr
- 7003 Nickaburr Creek Dr
- 7014 Charred Pine Dr
- 7103 Nickaburr Creek Dr
- 0 Nikaburr Creek
- 7018 Charred Pine Dr
- 7094 Nickaburr Creek Dr
- 7010 Nickaburr Creek Dr
- 7102 Charred Pine Dr
- 7090 Nickaburr Creek Dr
- 7107 Nickaburr Creek Dr
- 7102 Nickaburr Creek Dr
- 32918 Riverwood Dr
- 32922 Riverwood Dr
- 6926 Nickaburr Creek Dr
- 7106 Charred Pine Dr
- 0 Charred Pine
- 7106 Nickaburr Creek Dr
- 32914 Riverwood Dr
- L23B1 Nickaburr Creek Dr