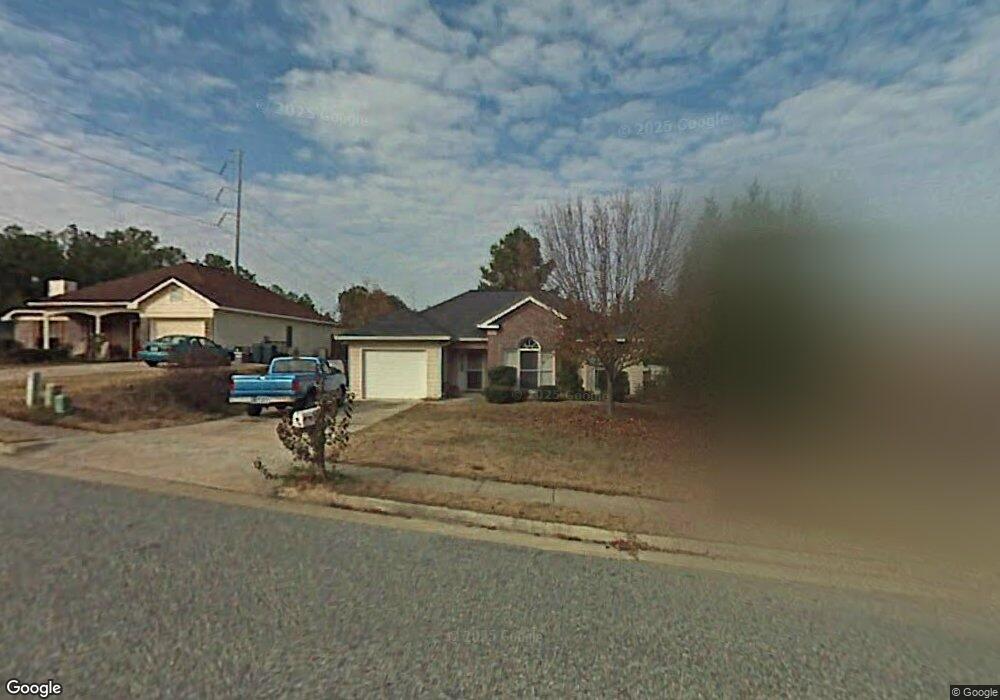
7007 Vinings Way Columbus, GA 31907
Midland NeighborhoodEstimated Value: $226,000 - $237,000
3
Beds
3
Baths
1,479
Sq Ft
$157/Sq Ft
Est. Value
About This Home
This home is located at 7007 Vinings Way, Columbus, GA 31907 and is currently estimated at $232,768, approximately $157 per square foot. 7007 Vinings Way is a home located in Muscogee County with nearby schools including Mathews Elementary School, Aaron Cohn Middle School, and Shaw High School.
Ownership History
Date
Name
Owned For
Owner Type
Purchase Details
Closed on
Jul 10, 2018
Sold by
Henderson Samuel Maurice
Bought by
Merida Taborda Daniela A and Merida Munoz Walter S
Current Estimated Value
Home Financials for this Owner
Home Financials are based on the most recent Mortgage that was taken out on this home.
Original Mortgage
$135,859
Outstanding Balance
$118,002
Interest Rate
4.6%
Mortgage Type
VA
Estimated Equity
$114,766
Purchase Details
Closed on
Feb 27, 2012
Sold by
Federal National Mortgage Association
Bought by
Henderson Samuel Maurice
Home Financials for this Owner
Home Financials are based on the most recent Mortgage that was taken out on this home.
Original Mortgage
$116,958
Interest Rate
3.75%
Mortgage Type
FHA
Purchase Details
Closed on
Aug 2, 2011
Sold by
Jpmorgan Chase Bank Nation
Bought by
Federal National Mtg Associati
Create a Home Valuation Report for This Property
The Home Valuation Report is an in-depth analysis detailing your home's value as well as a comparison with similar homes in the area
Home Values in the Area
Average Home Value in this Area
Purchase History
| Date | Buyer | Sale Price | Title Company |
|---|---|---|---|
| Merida Taborda Daniela A | $133,000 | -- | |
| Henderson Samuel Maurice | -- | -- | |
| Federal National Mtg Associati | $89,400 | -- | |
| Jpmorgan Chase Bank National A | $89,400 | -- |
Source: Public Records
Mortgage History
| Date | Status | Borrower | Loan Amount |
|---|---|---|---|
| Open | Merida Taborda Daniela A | $135,859 | |
| Previous Owner | Henderson Samuel Maurice | $116,958 |
Source: Public Records
Tax History Compared to Growth
Tax History
| Year | Tax Paid | Tax Assessment Tax Assessment Total Assessment is a certain percentage of the fair market value that is determined by local assessors to be the total taxable value of land and additions on the property. | Land | Improvement |
|---|---|---|---|---|
| 2025 | $2,776 | $70,924 | $13,964 | $56,960 |
| 2024 | $2,776 | $70,924 | $13,964 | $56,960 |
| 2023 | $2,794 | $70,924 | $13,964 | $56,960 |
| 2022 | $2,585 | $63,308 | $13,964 | $49,344 |
| 2021 | $2,079 | $50,920 | $13,964 | $36,956 |
| 2020 | $2,080 | $50,920 | $13,964 | $36,956 |
| 2019 | $2,086 | $50,920 | $13,964 | $36,956 |
| 2018 | $1,621 | $50,920 | $13,964 | $36,956 |
| 2017 | $1,628 | $50,920 | $13,964 | $36,956 |
| 2016 | $1,635 | $52,909 | $9,000 | $43,909 |
| 2015 | $1,638 | $52,909 | $9,000 | $43,909 |
| 2014 | $1,640 | $52,909 | $9,000 | $43,909 |
| 2013 | -- | $52,909 | $9,000 | $43,909 |
Source: Public Records
Map
Nearby Homes
- 7170 Beaver Run Rd
- 6321 Milgen Rd Unit 3
- 5717 Flat Rock Rd
- 7265 E Wynfield Loop
- 6437 Woodbriar Ln
- 2 Mink Ct
- 7593 Beaver Run Rd
- 5 Mink Ct
- 6544 Mink Dr
- 7613 Mockernut Way
- 6606 Widgeon Dr
- 6055 Psalmond Rd
- 7101 Cross Tie Dr
- 6834 Beaver Trail
- 6601 Psalmond Rd
- 5434 Rockhurst Dr
- 6454 Patriot Dr
- 6236 Olde Towne Dr
- 6215 Parker Dr
- 5640 Lakeshore Rd
- 7011 Vinings Way
- 7001 Vinings Way
- 7015 Vinings Way
- 7006 Vinings Way
- 7010 Vinings Way
- 7101 Vinings Ct
- 7105 Vinings Ct
- 7000 Vinings Way
- 7014 Vinings Way
- 7109 Vinings Ct
- 7018 Vinings Way
- 7113 Vinings Ct
- 7022 Vinings Way
- 7117 Vinings Ct
- 7026 Vinings Way
- 7121 Vinings Ct
- 7100 Vinings Ct
- 7104 Vinings Ct
- 6030 Flat Rock Rd
- 7108 Vinings Ct