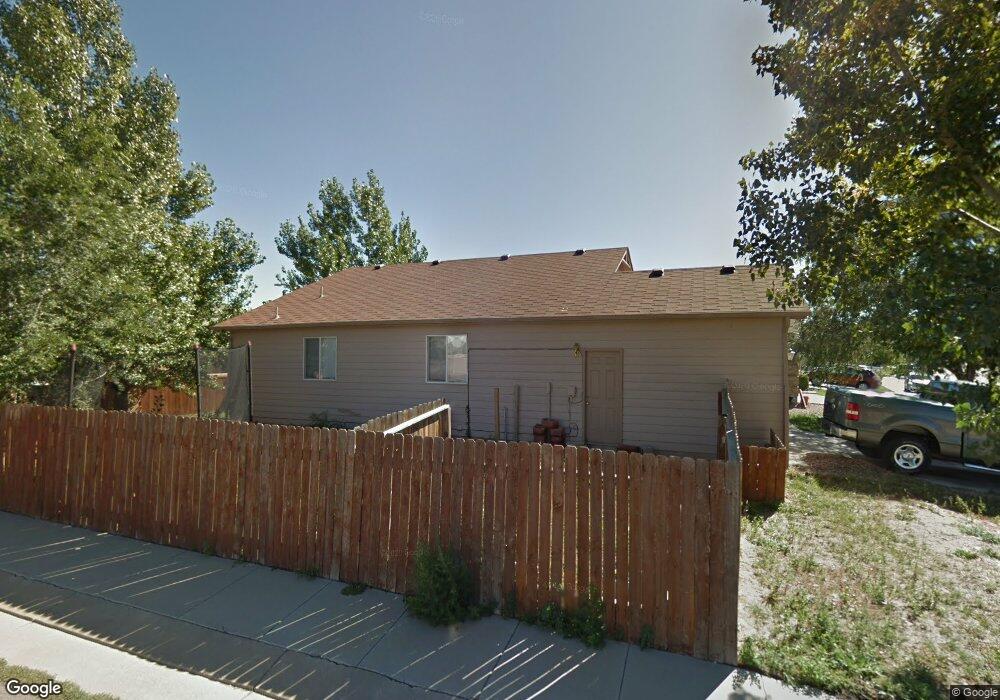
7008 Maram Way Fountain, CO 80817
North Fountain Valley NeighborhoodEstimated Value: $383,913 - $413,000
3
Beds
2
Baths
1,296
Sq Ft
$310/Sq Ft
Est. Value
About This Home
This home is located at 7008 Maram Way, Fountain, CO 80817 and is currently estimated at $401,728, approximately $309 per square foot. 7008 Maram Way is a home located in El Paso County with nearby schools including Mesa Elementary School, Fountain Middle School, and Fountain-Fort Carson High School.
Ownership History
Date
Name
Owned For
Owner Type
Purchase Details
Closed on
Apr 7, 2015
Sold by
Bracken Jeremy
Bought by
Thomas Julia M
Current Estimated Value
Home Financials for this Owner
Home Financials are based on the most recent Mortgage that was taken out on this home.
Original Mortgage
$181,649
Outstanding Balance
$142,966
Interest Rate
4.37%
Mortgage Type
FHA
Estimated Equity
$258,762
Purchase Details
Closed on
Nov 25, 2009
Sold by
Mccollam Judy Lynn
Bought by
Bracken Jeremy
Home Financials for this Owner
Home Financials are based on the most recent Mortgage that was taken out on this home.
Original Mortgage
$161,397
Interest Rate
4.99%
Mortgage Type
VA
Purchase Details
Closed on
May 1, 2001
Sold by
Elite Properties Of America Inc
Bought by
Mccollam Patrick Michael and Mccollam Judy Lynn
Home Financials for this Owner
Home Financials are based on the most recent Mortgage that was taken out on this home.
Original Mortgage
$148,200
Interest Rate
6.81%
Create a Home Valuation Report for This Property
The Home Valuation Report is an in-depth analysis detailing your home's value as well as a comparison with similar homes in the area
Home Values in the Area
Average Home Value in this Area
Purchase History
| Date | Buyer | Sale Price | Title Company |
|---|---|---|---|
| Thomas Julia M | $185,000 | Unified Title Company | |
| Bracken Jeremy | $158,000 | Utc | |
| Mccollam Patrick Michael | $156,010 | Land Title |
Source: Public Records
Mortgage History
| Date | Status | Borrower | Loan Amount |
|---|---|---|---|
| Open | Thomas Julia M | $181,649 | |
| Previous Owner | Bracken Jeremy | $161,397 | |
| Previous Owner | Mccollam Patrick Michael | $148,200 |
Source: Public Records
Tax History Compared to Growth
Tax History
| Year | Tax Paid | Tax Assessment Tax Assessment Total Assessment is a certain percentage of the fair market value that is determined by local assessors to be the total taxable value of land and additions on the property. | Land | Improvement |
|---|---|---|---|---|
| 2025 | $1,504 | $27,730 | -- | -- |
| 2024 | $1,345 | $28,610 | $4,340 | $24,270 |
| 2022 | $1,135 | $19,450 | $3,430 | $16,020 |
| 2021 | $1,054 | $20,010 | $3,530 | $16,480 |
| 2020 | $952 | $17,700 | $3,090 | $14,610 |
| 2019 | $934 | $17,700 | $3,090 | $14,610 |
| 2018 | $795 | $14,550 | $3,110 | $11,440 |
| 2017 | $786 | $14,550 | $3,110 | $11,440 |
| 2016 | $713 | $13,190 | $3,220 | $9,970 |
| 2015 | $714 | $13,190 | $3,220 | $9,970 |
| 2014 | $644 | $11,960 | $3,220 | $8,740 |
Source: Public Records
Map
Nearby Homes
- 6963 Maram Way
- 8342 Silver Glen Dr
- 8317 Hurley Dr
- 8402 Dassel Dr
- 7275 Bentwater Dr
- 7307 Glenburn Dr
- 2345 Conley Blvd
- 7191 Creekfront Dr
- 314 Maram Way
- 7202 Creekfront Dr
- 7287 Creekfront Dr
- 2081 Calle Fontana
- 2124 Bent Tree Ln
- 7275 Josh Byers Way
- 2023 Calle Corona
- 2031 Hibbard Ln
- 654 High Tea Ct
- 1255 Ancestra Dr
- 6698 Camino Del Rey
- 7950 Calamint Ct
- 7016 Maram Way
- 7024 Maram Way
- 6980 Maram Way
- 6975 Village Meadows Dr
- 7032 Maram Way
- 6972 Maram Way
- 6956 Village Meadows Dr
- 8302 Silver Glen Dr
- 8310 Silver Glen Dr
- 6965 Village Meadows Dr
- 8318 Silver Glen Dr
- 7040 Maram Way
- 6964 Maram Way
- 8286 Silver Glen Dr
- 6968 Kasson Dr
- 8326 Silver Glen Dr
- 6956 Kasson Dr
- 6955 Village Meadows Dr
- 8334 Silver Glen Dr
- 6946 Village Meadows Dr