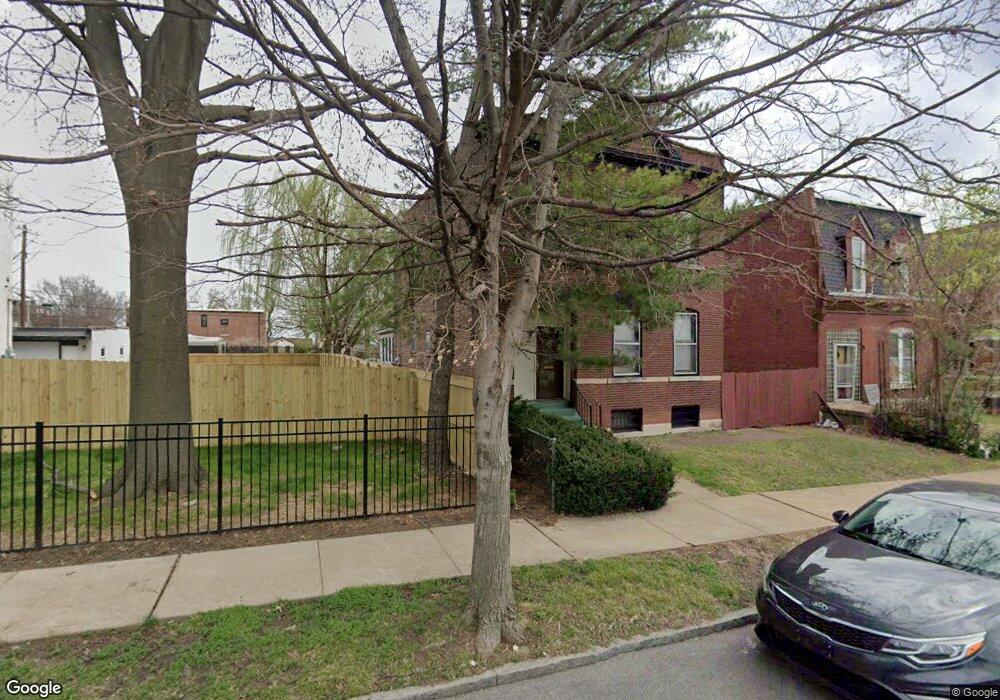
7008 Virginia Ave Saint Louis, MO 63111
Carondelet NeighborhoodEstimated Value: $163,000 - $285,000
4
Beds
2
Baths
1,860
Sq Ft
$119/Sq Ft
Est. Value
About This Home
This home is located at 7008 Virginia Ave, Saint Louis, MO 63111 and is currently estimated at $220,987, approximately $118 per square foot. 7008 Virginia Ave is a home located in St. Louis City with nearby schools including Lyon at Blow Elementary School, Woodward Elementary School, and Roosevelt High School.
Ownership History
Date
Name
Owned For
Owner Type
Purchase Details
Closed on
Dec 9, 2021
Sold by
Fnf Poperties Llc
Bought by
Blickhan James Tyler
Current Estimated Value
Home Financials for this Owner
Home Financials are based on the most recent Mortgage that was taken out on this home.
Original Mortgage
$98,000
Outstanding Balance
$25,603
Interest Rate
2.38%
Estimated Equity
$195,384
Purchase Details
Closed on
Feb 21, 2019
Sold by
Cedar Creek Investments Llc
Bought by
Fnf Properties Llc
Home Financials for this Owner
Home Financials are based on the most recent Mortgage that was taken out on this home.
Original Mortgage
$82,500
Interest Rate
4.4%
Mortgage Type
Future Advance Clause Open End Mortgage
Purchase Details
Closed on
Jun 29, 2007
Sold by
Singleton Ken and Singleton Kathy L
Bought by
Cedar Creek Investments Llc
Home Financials for this Owner
Home Financials are based on the most recent Mortgage that was taken out on this home.
Original Mortgage
$2,290,000
Interest Rate
6.41%
Mortgage Type
Purchase Money Mortgage
Create a Home Valuation Report for This Property
The Home Valuation Report is an in-depth analysis detailing your home's value as well as a comparison with similar homes in the area
Home Values in the Area
Average Home Value in this Area
Purchase History
| Date | Buyer | Sale Price | Title Company |
|---|---|---|---|
| Blickhan James Tyler | $122,500 | Us Title | |
| Fnf Properties Llc | -- | Title Experts Llc | |
| Cedar Creek Investments Llc | -- | None Available |
Source: Public Records
Mortgage History
| Date | Status | Borrower | Loan Amount |
|---|---|---|---|
| Open | Blickhan James Tyler | $98,000 | |
| Previous Owner | Fnf Properties Llc | $82,500 | |
| Previous Owner | Cedar Creek Investments Llc | $2,290,000 |
Source: Public Records
Tax History Compared to Growth
Tax History
| Year | Tax Paid | Tax Assessment Tax Assessment Total Assessment is a certain percentage of the fair market value that is determined by local assessors to be the total taxable value of land and additions on the property. | Land | Improvement |
|---|---|---|---|---|
| 2025 | $1,550 | $24,440 | $1,200 | $23,240 |
| 2024 | $1,475 | $18,180 | $1,200 | $16,980 |
| 2023 | $1,475 | $18,180 | $1,200 | $16,980 |
| 2022 | $1,392 | $16,500 | $1,200 | $15,300 |
| 2021 | $1,390 | $16,500 | $1,200 | $15,300 |
| 2020 | $1,320 | $15,770 | $1,200 | $14,570 |
| 2019 | $1,315 | $15,770 | $1,200 | $14,570 |
| 2018 | $1,012 | $11,690 | $1,200 | $10,490 |
| 2017 | $995 | $11,690 | $1,200 | $10,490 |
| 2016 | $1,337 | $15,620 | $1,200 | $14,420 |
| 2015 | $1,214 | $15,620 | $1,200 | $14,420 |
| 2014 | $1,224 | $15,620 | $1,200 | $14,420 |
| 2013 | -- | $15,770 | $1,200 | $14,570 |
Source: Public Records
Map
Nearby Homes
- 7027 Michigan Ave
- 7101 Virginia Ave
- 6822 Virginia Ave
- 7118 Vermont Ave
- 6924 Minnesota Ave
- 6803 Virginia Ave
- 7113 Alabama Ave
- 6901 Pennsylvania Ave
- 7226 Virginia Ave
- 6733 Alabama Ave
- 6906 Pennsylvania Ave
- 6707 Minnesota Ave Unit 6707 & 6709
- 617 Haven St
- 7227 Pennsylvania Ave
- 7310 Minnesota Ave
- 7343 Virginia Ave
- 7301 Pennsylvania Ave
- 6619 Vermont Ave
- 7220 Pennsylvania Ave
- 419 Mott St
- 7012 Virginia Ave
- 7004 Virginia Ave
- 7014 Virginia Ave
- 7016 Virginia Ave
- 7024 Virginia Ave
- 7009 Michigan Ave
- 7011 Michigan Ave
- 7001 Michigan Ave
- 7017 Michigan Ave
- 6926 Virginia Ave
- 7023 Michigan Ave
- 6929 Michigan Ave
- 6927 Michigan Ave
- 6927 Michigan Ave
- 6920 Virginia Ave
- 6916 Virginia Ave
- 6921 Michigan Ave Unit 2F
- 6919 Michigan Ave
- 6919 Michigan Ave
- 6919 Michigan Ave Unit 1F