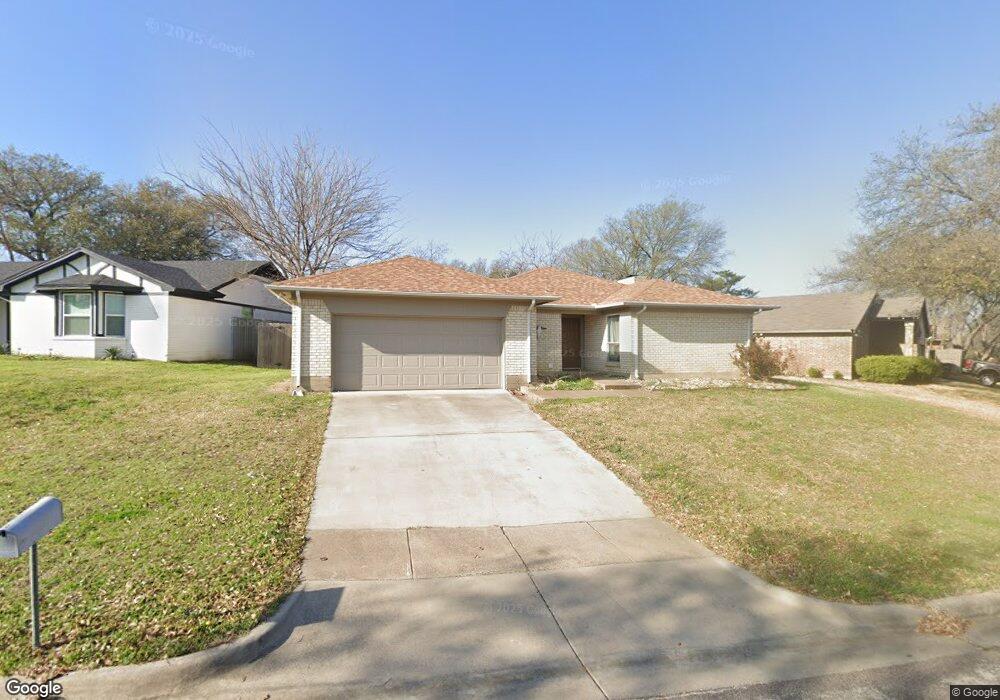
7008 Woodmoor Rd Fort Worth, TX 76133
Candleridge NeighborhoodEstimated Value: $269,285 - $282,000
3
Beds
2
Baths
1,625
Sq Ft
$169/Sq Ft
Est. Value
About This Home
This home is located at 7008 Woodmoor Rd, Fort Worth, TX 76133 and is currently estimated at $274,321, approximately $168 per square foot. 7008 Woodmoor Rd is a home located in Tarrant County with nearby schools including Woodway Elementary School, Wedgwood Middle School, and Wedgwood Sixth Grade Center.
Ownership History
Date
Name
Owned For
Owner Type
Purchase Details
Closed on
Apr 4, 2019
Sold by
Morrison Eric J and Morrison Ann G
Bought by
Fisher Bethany H
Current Estimated Value
Home Financials for this Owner
Home Financials are based on the most recent Mortgage that was taken out on this home.
Original Mortgage
$142,500
Outstanding Balance
$125,283
Interest Rate
4.3%
Mortgage Type
Purchase Money Mortgage
Estimated Equity
$149,038
Purchase Details
Closed on
Jun 14, 2017
Sold by
Saxon Catherine R
Bought by
Morrison Eric J and Morrison Anna G
Home Financials for this Owner
Home Financials are based on the most recent Mortgage that was taken out on this home.
Original Mortgage
$158,650
Interest Rate
4.02%
Mortgage Type
New Conventional
Purchase Details
Closed on
Mar 10, 2017
Sold by
Karen Stovall J and Karen Stovall M
Bought by
Saxon Catherine R
Create a Home Valuation Report for This Property
The Home Valuation Report is an in-depth analysis detailing your home's value as well as a comparison with similar homes in the area
Home Values in the Area
Average Home Value in this Area
Purchase History
| Date | Buyer | Sale Price | Title Company |
|---|---|---|---|
| Fisher Bethany H | -- | Republic Title Of Texas | |
| Morrison Eric J | -- | Alamo Title Co | |
| Saxon Catherine R | -- | Trinity Title Co |
Source: Public Records
Mortgage History
| Date | Status | Borrower | Loan Amount |
|---|---|---|---|
| Open | Fisher Bethany H | $142,500 | |
| Previous Owner | Morrison Eric J | $158,650 |
Source: Public Records
Tax History Compared to Growth
Tax History
| Year | Tax Paid | Tax Assessment Tax Assessment Total Assessment is a certain percentage of the fair market value that is determined by local assessors to be the total taxable value of land and additions on the property. | Land | Improvement |
|---|---|---|---|---|
| 2025 | $6,291 | $280,372 | $35,000 | $245,372 |
| 2024 | $6,291 | $280,372 | $35,000 | $245,372 |
| 2023 | $6,927 | $306,131 | $35,000 | $271,131 |
| 2022 | $5,993 | $230,534 | $35,000 | $195,534 |
| 2021 | $5,707 | $208,052 | $35,000 | $173,052 |
| 2020 | $4,677 | $176,717 | $35,000 | $141,717 |
| 2019 | $4,761 | $173,075 | $35,000 | $138,075 |
| 2018 | $4,438 | $161,333 | $28,000 | $133,333 |
| 2017 | $3,245 | $114,534 | $28,000 | $86,534 |
| 2016 | $2,916 | $102,920 | $28,000 | $74,920 |
| 2015 | $2,257 | $72,102 | $16,000 | $56,102 |
| 2014 | $2,257 | $79,500 | $16,000 | $63,500 |
Source: Public Records
Map
Nearby Homes
- 3753 Misty Meadow Dr
- 3809 Misty Meadow Dr
- 3817 Misty Meadow Dr
- 6905 W Cleburne Rd
- 6817 W Cleburne Rd
- 7000 Santa Rita Ct
- 3913 Misty Meadow Dr
- 3901 Willow Way Rd
- 7008 Natchez Ct
- 3804 Memphis Ln
- 6808 Westglen Dr
- 4021 Toledo Ave
- 3254 Amber Ct
- 7100 Mccart Ave
- 6709 Santiago Ave
- 4021 Aragon Dr
- 7108 Southridge Trail
- 4032 Aragon Dr
- 2912 Southpark Ln
- 2862 Southpark Ln
- 7004 Woodmoor Rd
- 7012 Woodmoor Rd
- 3825 Misty Meadow Dr
- 3821 Misty Meadow Dr
- 3800 Sugar Ridge Rd
- 7013 Woodmoor Rd
- 7017 Woodmoor Rd
- 3829 Misty Meadow Dr
- 7009 Woodmoor Rd
- 7005 Woodmoor Rd
- 7021 Woodmoor Rd
- 3812 Sugar Ridge Rd
- 7025 Woodmoor Rd
- 3833 Misty Meadow Dr
- 3813 Misty Meadow Dr
- 3816 Sugar Ridge Rd
- 3741 Misty Meadow Dr
- 7029 Woodmoor Rd
- 3737 Misty Meadow Dr
- 3745 Misty Meadow Dr