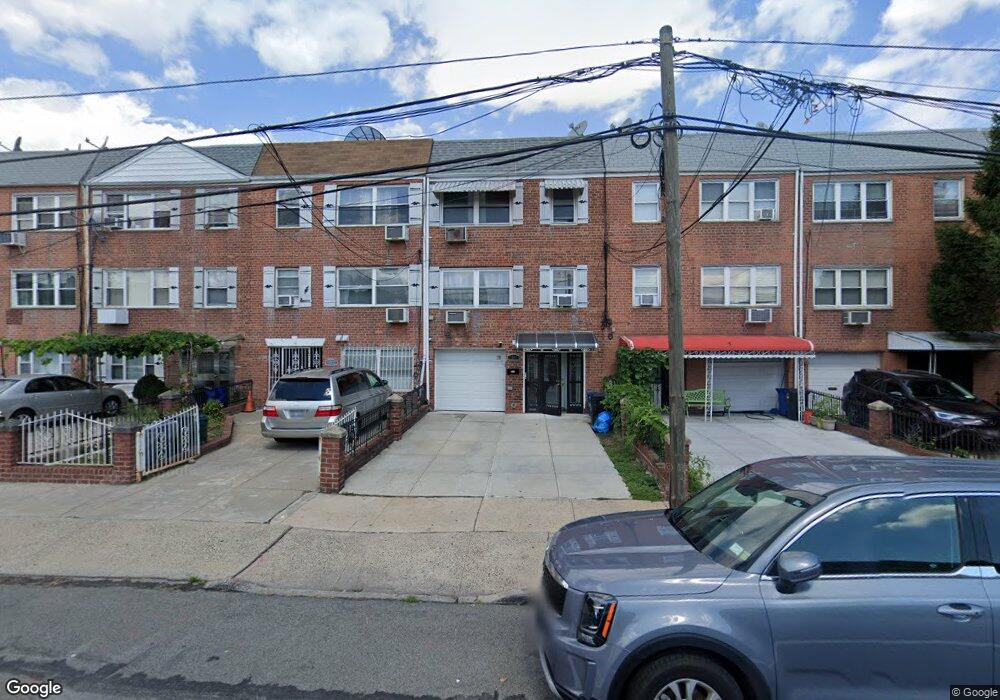
7009 31st Ave East Elmhurst, NY 11370
Jackson Heights NeighborhoodEstimated Value: $1,400,259 - $1,532,000
--
Bed
--
Bath
2,650
Sq Ft
$548/Sq Ft
Est. Value
About This Home
This home is located at 7009 31st Ave, East Elmhurst, NY 11370 and is currently estimated at $1,452,065, approximately $547 per square foot. 7009 31st Ave is a home located in Queens County with nearby schools including Ps 152 Gwendolyn N Alleyne School, I.S. 010 Horace Greeley, and William Cullen Bryant High School.
Ownership History
Date
Name
Owned For
Owner Type
Purchase Details
Closed on
Jul 14, 2015
Sold by
Lolis Vassilia
Bought by
Stavrou Chris
Current Estimated Value
Home Financials for this Owner
Home Financials are based on the most recent Mortgage that was taken out on this home.
Original Mortgage
$250,000
Outstanding Balance
$195,682
Interest Rate
3.97%
Mortgage Type
New Conventional
Estimated Equity
$1,256,383
Create a Home Valuation Report for This Property
The Home Valuation Report is an in-depth analysis detailing your home's value as well as a comparison with similar homes in the area
Home Values in the Area
Average Home Value in this Area
Purchase History
| Date | Buyer | Sale Price | Title Company |
|---|---|---|---|
| Stavrou Chris | $950,000 | -- |
Source: Public Records
Mortgage History
| Date | Status | Borrower | Loan Amount |
|---|---|---|---|
| Open | Stavrou Chris | $250,000 |
Source: Public Records
Tax History Compared to Growth
Tax History
| Year | Tax Paid | Tax Assessment Tax Assessment Total Assessment is a certain percentage of the fair market value that is determined by local assessors to be the total taxable value of land and additions on the property. | Land | Improvement |
|---|---|---|---|---|
| 2025 | $12,035 | $63,301 | $9,370 | $53,931 |
| 2024 | $12,035 | $59,922 | $10,075 | $49,847 |
| 2023 | $11,354 | $56,532 | $8,910 | $47,622 |
| 2022 | $10,928 | $76,260 | $12,540 | $63,720 |
| 2021 | $11,521 | $70,140 | $12,540 | $57,600 |
| 2020 | $11,166 | $69,360 | $12,540 | $56,820 |
| 2019 | $10,446 | $69,240 | $12,540 | $56,700 |
| 2018 | $9,603 | $47,110 | $10,879 | $36,231 |
| 2017 | $9,299 | $45,619 | $10,047 | $35,572 |
| 2016 | $9,120 | $45,619 | $10,047 | $35,572 |
| 2015 | $2,157 | $43,959 | $11,097 | $32,862 |
| 2014 | $2,157 | $41,613 | $12,473 | $29,140 |
Source: Public Records
Map
Nearby Homes