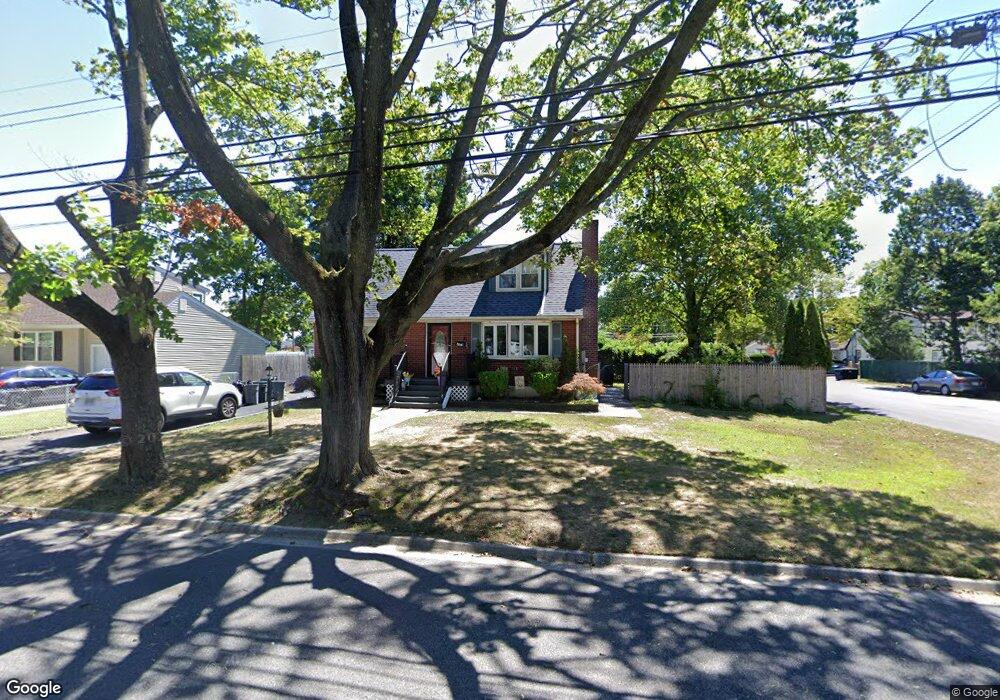
701 10th St West Babylon, NY 11704
Estimated Value: $600,000 - $698,000
1
Bed
1
Bath
1,275
Sq Ft
$510/Sq Ft
Est. Value
About This Home
This home is located at 701 10th St, West Babylon, NY 11704 and is currently estimated at $650,674, approximately $510 per square foot. 701 10th St is a home located in Suffolk County with nearby schools including West Babylon Senior High School.
Ownership History
Date
Name
Owned For
Owner Type
Purchase Details
Closed on
Aug 21, 2012
Sold by
Johnson Richard R
Bought by
Johnson Richard R and Willett Lisa M
Current Estimated Value
Purchase Details
Closed on
Feb 28, 2008
Sold by
Dugan Christopher
Bought by
Johnson Richard R
Purchase Details
Closed on
Jul 27, 2004
Sold by
Dugan Christopher
Bought by
Dugan Christopher and Cotter Thomas
Purchase Details
Closed on
Oct 25, 2000
Sold by
Dugan Christopher and Cotter Thomas
Bought by
Dugan Christopher
Purchase Details
Closed on
Apr 26, 1999
Sold by
Dugan Christopher
Bought by
Dugan Christopher and Cotter Thomas
Create a Home Valuation Report for This Property
The Home Valuation Report is an in-depth analysis detailing your home's value as well as a comparison with similar homes in the area
Home Values in the Area
Average Home Value in this Area
Purchase History
| Date | Buyer | Sale Price | Title Company |
|---|---|---|---|
| Johnson Richard R | -- | Abstracts Inc | |
| Johnson Richard R | $402,000 | Alan Davis | |
| Dugan Christopher | $176,500 | Commonwealth Title | |
| Dugan Christopher | -- | Commonwealth Land Title Ins | |
| Dugan Christopher | $7,500 | Commonwealth Land Title Ins |
Source: Public Records
Tax History
| Year | Tax Paid | Tax Assessment Tax Assessment Total Assessment is a certain percentage of the fair market value that is determined by local assessors to be the total taxable value of land and additions on the property. | Land | Improvement |
|---|---|---|---|---|
| 2024 | $12,348 | $3,480 | $340 | $3,140 |
| 2023 | $12,348 | $3,480 | $340 | $3,140 |
| 2022 | $10,275 | $3,480 | $340 | $3,140 |
| 2021 | $10,275 | $3,480 | $340 | $3,140 |
| 2020 | $10,731 | $3,480 | $340 | $3,140 |
| 2019 | $10,731 | $0 | $0 | $0 |
| 2018 | $10,182 | $3,480 | $340 | $3,140 |
| 2017 | $10,182 | $3,480 | $340 | $3,140 |
| 2016 | $10,884 | $3,720 | $340 | $3,380 |
| 2015 | -- | $3,460 | $340 | $3,120 |
| 2014 | -- | $3,460 | $340 | $3,120 |
Source: Public Records
Map
Nearby Homes
Your Personal Tour Guide
Ask me questions while you tour the home.