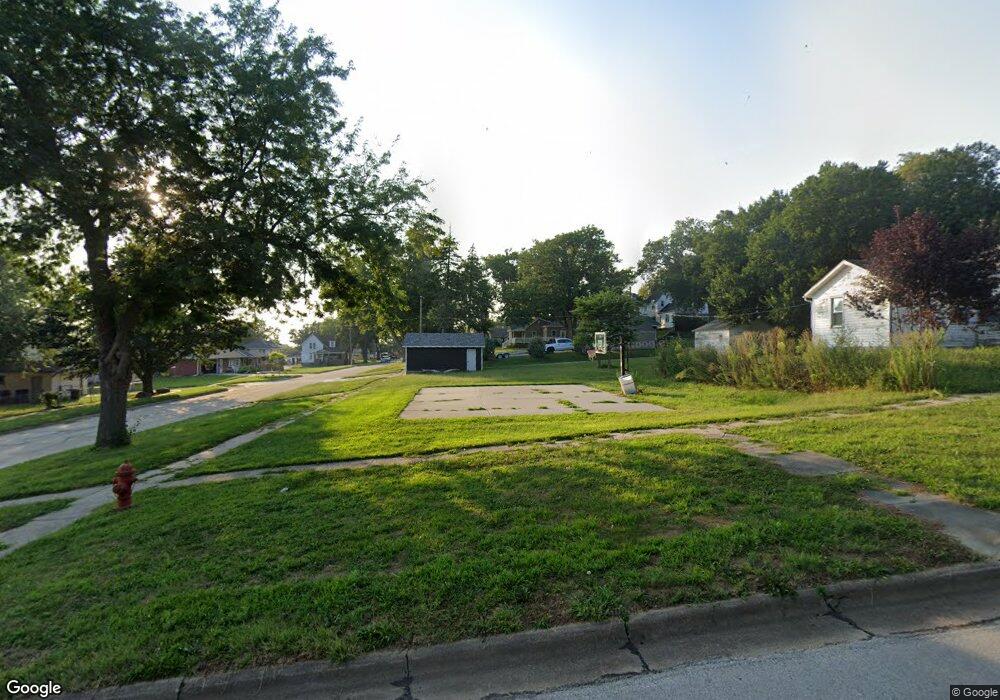
701 11th St Wisner, NE 68791
Estimated Value: $62,804 - $175,000
Studio
--
Bath
--
Sq Ft
8,407
Sq Ft
About This Home
This home is located at 701 11th St, Wisner, NE 68791 and is currently estimated at $100,268. 701 11th St is a home located in Cuming County with nearby schools including Wisner-Pilger Elementary School, Wisner-Pilger Middle School, and Wisner-Pilger High School.
Ownership History
Date
Name
Owned For
Owner Type
Purchase Details
Closed on
Dec 21, 2023
Sold by
Wistown Rentals Llc
Bought by
Wistown Properties Llc
Current Estimated Value
Purchase Details
Closed on
Jan 5, 2023
Sold by
Maxwell Richard A
Bought by
Jt Rentals Llc
Home Financials for this Owner
Home Financials are based on the most recent Mortgage that was taken out on this home.
Original Mortgage
$30,708
Interest Rate
6.58%
Mortgage Type
New Conventional
Purchase Details
Closed on
Dec 11, 2020
Sold by
Feller Jordan and Feller Megan
Bought by
Maxwell Richard A
Purchase Details
Closed on
Jun 7, 2019
Sold by
Mccarthy Nicholas J and Mccarthy Jennifer M
Bought by
Feller Jordan and Feller Megan
Home Financials for this Owner
Home Financials are based on the most recent Mortgage that was taken out on this home.
Original Mortgage
$9,050
Interest Rate
4.1%
Mortgage Type
Future Advance Clause Open End Mortgage
Create a Home Valuation Report for This Property
The Home Valuation Report is an in-depth analysis detailing your home's value as well as a comparison with similar homes in the area
Purchase History
| Date | Buyer | Sale Price | Title Company |
|---|---|---|---|
| Wistown Properties Llc | -- | None Listed On Document | |
| Contreras Jesus Castaneda | -- | None Listed On Document | |
| Jt Rentals Llc | -- | -- | |
| Maxwell Richard A | $16,000 | None Available | |
| Feller Jordan | $10,000 | Stewart Title Company |
Source: Public Records
Mortgage History
| Date | Status | Borrower | Loan Amount |
|---|---|---|---|
| Previous Owner | Jt Rentals Llc | $30,708 | |
| Previous Owner | Feller Jordan | $9,050 |
Source: Public Records
Tax History
| Year | Tax Paid | Tax Assessment Tax Assessment Total Assessment is a certain percentage of the fair market value that is determined by local assessors to be the total taxable value of land and additions on the property. | Land | Improvement |
|---|---|---|---|---|
| 2025 | $108 | $13,585 | $7,140 | $6,445 |
| 2024 | $121 | $13,415 | $7,140 | $6,275 |
| 2023 | $129 | $11,510 | $5,460 | $6,050 |
| 2022 | $131 | $11,000 | $5,040 | $5,960 |
| 2021 | $105 | $8,410 | $2,940 | $5,470 |
| 2020 | $106 | $8,335 | $2,940 | $5,395 |
| 2019 | $107 | $8,175 | $2,940 | $5,235 |
| 2018 | $72 | $5,475 | $2,940 | $2,535 |
| 2017 | $77 | $5,675 | $3,360 | $2,315 |
| 2016 | $80 | $5,675 | $3,360 | $2,315 |
| 2015 | $81 | $5,675 | $3,360 | $2,315 |
| 2014 | $98 | $5,595 | $3,360 | $2,235 |
| 2013 | $98 | $5,295 | $3,360 | $1,935 |
Source: Public Records
Map
Nearby Homes
Your Personal Tour Guide
Ask me questions while you tour the home.