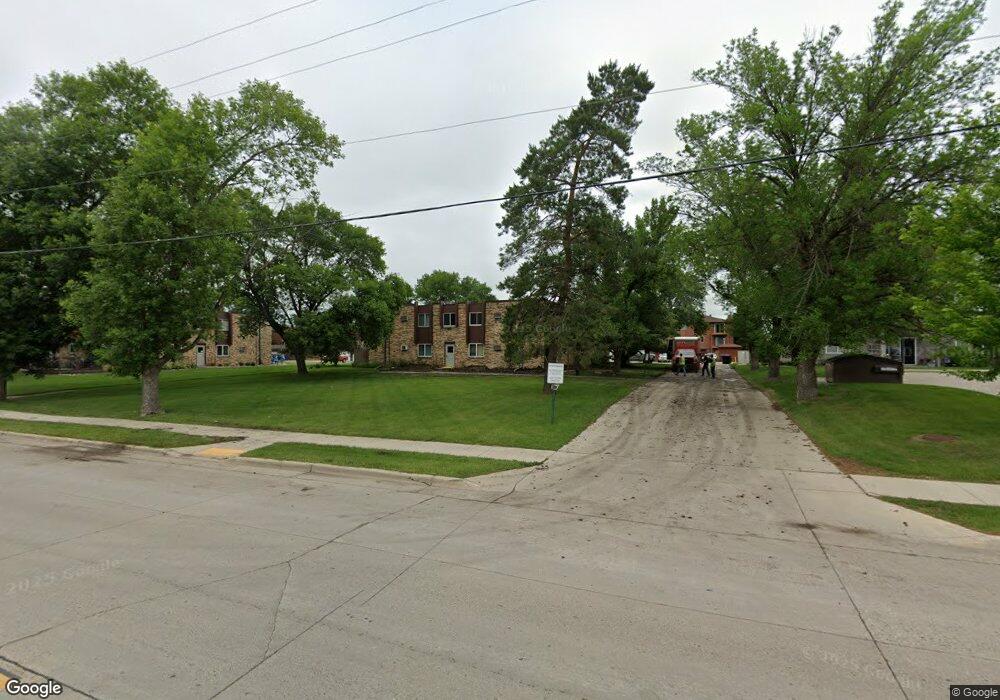
701 32nd Ave N Unit C203 Fargo, ND 58102
Trollwood NeighborhoodEstimated Value: $141,000 - $155,000
3
Beds
2
Baths
1,108
Sq Ft
$133/Sq Ft
Est. Value
About This Home
This home is located at 701 32nd Ave N Unit C203, Fargo, ND 58102 and is currently estimated at $146,882, approximately $132 per square foot. 701 32nd Ave N Unit C203 is a home located in Cass County with nearby schools including McKinley Elementary School, Ben Franklin Middle School, and North High School.
Ownership History
Date
Name
Owned For
Owner Type
Purchase Details
Closed on
Aug 31, 2005
Sold by
Phillips David H and Phillips Colleen M
Bought by
Graham Debra E
Current Estimated Value
Home Financials for this Owner
Home Financials are based on the most recent Mortgage that was taken out on this home.
Original Mortgage
$76,500
Outstanding Balance
$40,851
Interest Rate
5.82%
Mortgage Type
FHA
Estimated Equity
$106,031
Create a Home Valuation Report for This Property
The Home Valuation Report is an in-depth analysis detailing your home's value as well as a comparison with similar homes in the area
Home Values in the Area
Average Home Value in this Area
Purchase History
| Date | Buyer | Sale Price | Title Company |
|---|---|---|---|
| Graham Debra E | -- | -- |
Source: Public Records
Mortgage History
| Date | Status | Borrower | Loan Amount |
|---|---|---|---|
| Open | Graham Debra E | $76,500 |
Source: Public Records
Tax History Compared to Growth
Tax History
| Year | Tax Paid | Tax Assessment Tax Assessment Total Assessment is a certain percentage of the fair market value that is determined by local assessors to be the total taxable value of land and additions on the property. | Land | Improvement |
|---|---|---|---|---|
| 2024 | $110 | $64,150 | $11,850 | $52,300 |
| 2023 | $110 | $64,150 | $11,850 | $52,300 |
| 2022 | $1,779 | $61,700 | $11,850 | $49,850 |
| 2021 | $1,749 | $61,700 | $11,850 | $49,850 |
| 2020 | $1,650 | $58,750 | $11,850 | $46,900 |
| 2019 | $1,651 | $65,050 | $6,350 | $58,700 |
| 2018 | $1,303 | $46,100 | $6,350 | $39,750 |
| 2017 | $1,213 | $43,100 | $6,350 | $36,750 |
| 2016 | $1,019 | $39,200 | $6,350 | $32,850 |
| 2015 | $1,080 | $39,200 | $4,350 | $34,850 |
| 2014 | $1,158 | $41,250 | $4,350 | $36,900 |
| 2013 | $1,097 | $41,250 | $4,350 | $36,900 |
Source: Public Records
Map
Nearby Homes
- 801 32nd Ave N Unit A102
- 3129 8th St N
- 501 Forest Ave N Unit C
- 1031 Gibraltor Ave
- 3217 Cherry Ln N
- 3306 2nd St N Unit D26
- 2926 Edgewood Dr N
- 2937 Edgewood Dr N
- 2902 3rd St N
- 2925 Edgewood Dr N
- 108 32nd Ave N
- 2807 Edgewood Dr N
- 3531 1st St N
- 310 27th Ave N
- 21 35th Ave NE
- 2510 10th St N
- 87 28th Ave N
- 418 25th Ave N
- 101 27th Ave N
- 2512 2nd St N
- 715 32nd Ave N Unit B104
- 701 32nd Ave N Unit C204
- 701 32nd Ave N Unit C202
- 701 32nd Ave N Unit C201
- 701 32nd Ave N Unit C104
- 701 32nd Ave N Unit C103
- 701 32nd Ave N Unit C102
- 701 32nd Ave N Unit C101
- 715 32nd Ave N Unit B204
- 715 32nd Ave N Unit B203
- 715 32nd Ave N Unit B202
- 715 32nd Ave N Unit B201
- 715 32nd Ave N Unit B103
- 715 32nd Ave N Unit B102
- 715 32nd Ave N Unit B101
- 715 32nd Ave N
- 701 32nd Ave N
- 715 32nd Ave N Unit 101 B
- 801 32nd Ave N Unit A202
- 801 32nd Ave N Unit A204