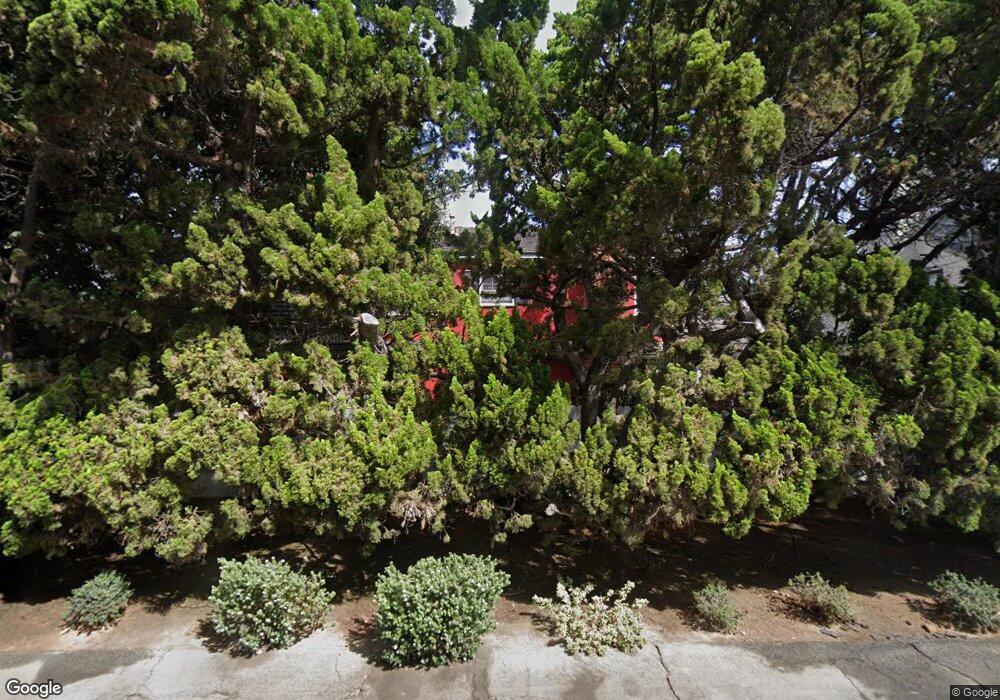
701 33rd St Manhattan Beach, CA 90266
Estimated Value: $3,127,000 - $4,381,000
4
Beds
4
Baths
3,067
Sq Ft
$1,240/Sq Ft
Est. Value
About This Home
This home is located at 701 33rd St, Manhattan Beach, CA 90266 and is currently estimated at $3,803,228, approximately $1,240 per square foot. 701 33rd St is a home located in Los Angeles County with nearby schools including Grand View Elementary School, Manhattan Beach Middle School, and Mira Costa High School.
Ownership History
Date
Name
Owned For
Owner Type
Purchase Details
Closed on
Aug 26, 2025
Sold by
Erlich Family Trust and Erlich Michael
Bought by
701 33Rd Street Llc
Current Estimated Value
Purchase Details
Closed on
Oct 11, 2006
Sold by
Erlich Michael and Erlich Helena
Bought by
Erlich Michael
Home Financials for this Owner
Home Financials are based on the most recent Mortgage that was taken out on this home.
Original Mortgage
$222,000
Interest Rate
6.37%
Mortgage Type
New Conventional
Create a Home Valuation Report for This Property
The Home Valuation Report is an in-depth analysis detailing your home's value as well as a comparison with similar homes in the area
Home Values in the Area
Average Home Value in this Area
Purchase History
| Date | Buyer | Sale Price | Title Company |
|---|---|---|---|
| 701 33Rd Street Llc | -- | None Listed On Document | |
| Erlich Michael | -- | Accommodation | |
| Erlich Michael | -- | United Title Company |
Source: Public Records
Mortgage History
| Date | Status | Borrower | Loan Amount |
|---|---|---|---|
| Previous Owner | Erlich Michael | $222,000 |
Source: Public Records
Tax History
| Year | Tax Paid | Tax Assessment Tax Assessment Total Assessment is a certain percentage of the fair market value that is determined by local assessors to be the total taxable value of land and additions on the property. | Land | Improvement |
|---|---|---|---|---|
| 2025 | $6,097 | $506,987 | $311,044 | $195,943 |
| 2024 | $6,097 | $497,047 | $304,946 | $192,101 |
| 2023 | $5,826 | $487,302 | $298,967 | $188,335 |
| 2022 | $5,728 | $477,748 | $293,105 | $184,643 |
| 2021 | $5,666 | $468,381 | $287,358 | $181,023 |
| 2019 | $5,517 | $454,490 | $278,836 | $175,654 |
| 2018 | $5,340 | $445,579 | $273,369 | $172,210 |
| 2016 | $4,993 | $428,278 | $262,754 | $165,524 |
| 2015 | $4,893 | $421,846 | $258,808 | $163,038 |
| 2014 | $4,839 | $413,584 | $253,739 | $159,845 |
Source: Public Records
Map
Nearby Homes
Your Personal Tour Guide
Ask me questions while you tour the home.