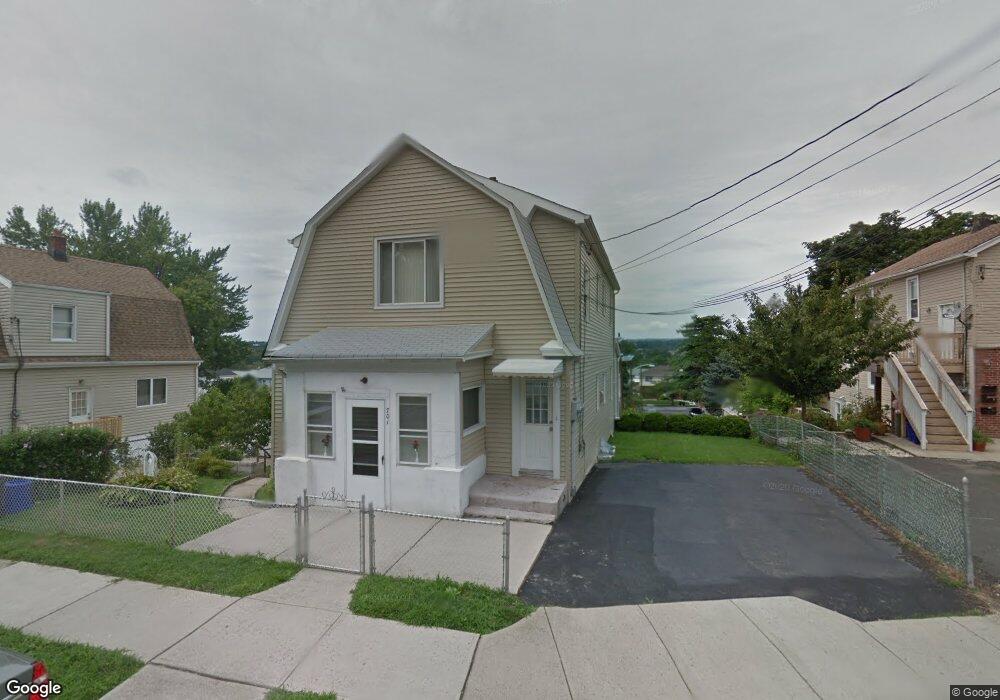
701 8th St Lyndhurst, NJ 07071
Estimated Value: $716,000 - $766,012
2
Beds
1
Bath
2,070
Sq Ft
$357/Sq Ft
Est. Value
About This Home
This home is located at 701 8th St, Lyndhurst, NJ 07071 and is currently estimated at $739,253, approximately $357 per square foot. 701 8th St is a home located in Bergen County with nearby schools including Lyndhurst High School and Sacred Heart School.
Ownership History
Date
Name
Owned For
Owner Type
Purchase Details
Closed on
Oct 4, 2019
Sold by
Diaz Orielsy
Bought by
Diaz Orielsy and Cabrera Cristina
Current Estimated Value
Home Financials for this Owner
Home Financials are based on the most recent Mortgage that was taken out on this home.
Original Mortgage
$451,044
Outstanding Balance
$390,777
Interest Rate
3.4%
Mortgage Type
VA
Estimated Equity
$348,476
Purchase Details
Closed on
Apr 6, 2018
Sold by
Departo Susannah Est and Departo Ex Michael
Bought by
Diaz Orielsy
Create a Home Valuation Report for This Property
The Home Valuation Report is an in-depth analysis detailing your home's value as well as a comparison with similar homes in the area
Home Values in the Area
Average Home Value in this Area
Purchase History
| Date | Buyer | Sale Price | Title Company |
|---|---|---|---|
| Diaz Orielsy | -- | None Available | |
| Diaz Orielsy | $440,000 | -- |
Source: Public Records
Mortgage History
| Date | Status | Borrower | Loan Amount |
|---|---|---|---|
| Open | Diaz Orielsy | $451,044 |
Source: Public Records
Tax History
| Year | Tax Paid | Tax Assessment Tax Assessment Total Assessment is a certain percentage of the fair market value that is determined by local assessors to be the total taxable value of land and additions on the property. | Land | Improvement |
|---|---|---|---|---|
| 2025 | $12,113 | $587,300 | $261,500 | $325,800 |
| 2024 | $11,664 | $580,700 | $258,500 | $322,200 |
| 2023 | $9,798 | $574,000 | $255,500 | $318,500 |
| 2022 | $9,798 | $308,900 | $170,500 | $138,400 |
| 2021 | $9,119 | $308,900 | $170,500 | $138,400 |
| 2020 | $9,187 | $308,900 | $170,500 | $138,400 |
| 2019 | $9,119 | $308,900 | $170,500 | $138,400 |
| 2018 | $9,193 | $308,900 | $170,500 | $138,400 |
| 2017 | $8,961 | $308,900 | $170,500 | $138,400 |
| 2016 | $8,760 | $308,900 | $170,500 | $138,400 |
| 2015 | $8,485 | $308,900 | $170,500 | $138,400 |
| 2014 | $8,374 | $308,900 | $170,500 | $138,400 |
Source: Public Records
Map
Nearby Homes
- 471 Harding Ave
- 609 Chase Ave
- 416 Kingsland Ave
- 105 Jauncey Ave
- 773 5th St
- 715 Tyler St
- 752 Ridge Rd
- 117 Lincoln Ave
- 715 Stuyvesant Ave
- 521 Weart Ave
- 825 Riverside Ave Unit 207
- 433 Chase Ave
- 20 Bergen Ave
- 619 Lewandowski St
- 734 Louise Ct
- 230 New St
- 75 Birchwood Dr
- 319 Ridge Rd
- 184 Albert St
- 623 Schuyler Ave Unit 302
Your Personal Tour Guide
Ask me questions while you tour the home.