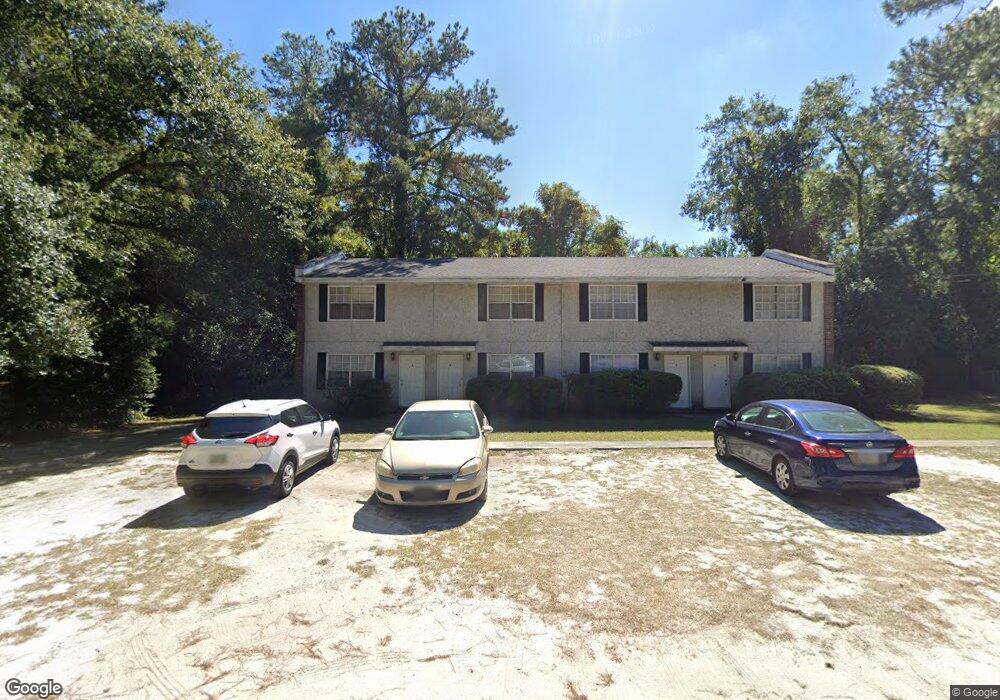
701 Bay St Waycross, GA 31501
Estimated Value: $327,912
--
Bed
4
Baths
2,001
Sq Ft
$164/Sq Ft
Est. Value
About This Home
This home is located at 701 Bay St, Waycross, GA 31501 and is currently estimated at $327,912, approximately $163 per square foot. 701 Bay St is a home located in Ware County with nearby schools including Center Elementary School, Waycross Middle School, and Ware County High School.
Ownership History
Date
Name
Owned For
Owner Type
Purchase Details
Closed on
Dec 14, 2006
Sold by
Mulkey Robert Chad
Bought by
Manning Robert and Manning Nelda
Current Estimated Value
Home Financials for this Owner
Home Financials are based on the most recent Mortgage that was taken out on this home.
Original Mortgage
$124,720
Outstanding Balance
$74,070
Interest Rate
6.19%
Mortgage Type
Commercial
Estimated Equity
$253,842
Purchase Details
Closed on
Mar 31, 2006
Sold by
Demeis Henry J
Bought by
Mulkey Robert Chad and Mulkey Sharon
Purchase Details
Closed on
Oct 17, 2001
Sold by
Flag Bank
Bought by
Demeis Henry and Demeis Linda
Purchase Details
Closed on
May 1, 2001
Sold by
Bryson J Allen
Bought by
Flag Bank
Purchase Details
Closed on
Feb 14, 1997
Sold by
Bryson Bryson J and Bryson Ant
Bought by
Bryson J Allen
Purchase Details
Closed on
May 20, 1996
Sold by
Bryson J Allen
Bought by
Bryson Bryson J and Bryson Ant
Purchase Details
Closed on
Feb 17, 1995
Bought by
Bryson J Allen
Purchase Details
Closed on
Jul 27, 1994
Bought by
Bryson Bryson J and Bryson Ant
Purchase Details
Closed on
Dec 1, 1980
Create a Home Valuation Report for This Property
The Home Valuation Report is an in-depth analysis detailing your home's value as well as a comparison with similar homes in the area
Home Values in the Area
Average Home Value in this Area
Purchase History
| Date | Buyer | Sale Price | Title Company |
|---|---|---|---|
| Manning Robert | $155,900 | -- | |
| Mulkey Robert Chad | $135,000 | -- | |
| Demeis Henry | $100 | -- | |
| Flag Bank | $161,100 | -- | |
| Bryson J Allen | -- | -- | |
| Bryson Bryson J | -- | -- | |
| Bryson J Allen | $105,000 | -- | |
| Bryson Bryson J | $80,000 | -- | |
| -- | -- | -- |
Source: Public Records
Mortgage History
| Date | Status | Borrower | Loan Amount |
|---|---|---|---|
| Open | Manning Robert | $124,720 | |
| Closed | Mulkey Robert Chad | $0 |
Source: Public Records
Tax History Compared to Growth
Tax History
| Year | Tax Paid | Tax Assessment Tax Assessment Total Assessment is a certain percentage of the fair market value that is determined by local assessors to be the total taxable value of land and additions on the property. | Land | Improvement |
|---|---|---|---|---|
| 2024 | $2,406 | $71,215 | $7,320 | $63,895 |
| 2023 | $2,456 | $71,215 | $7,320 | $63,895 |
| 2022 | $2,838 | $87,167 | $8,959 | $78,208 |
| 2021 | $2,385 | $77,527 | $8,959 | $68,568 |
| 2020 | $2,444 | $56,085 | $8,959 | $47,126 |
| 2019 | $2,355 | $53,264 | $8,959 | $44,305 |
| 2018 | $2,299 | $51,501 | $8,959 | $42,542 |
| 2017 | $2,246 | $51,501 | $8,959 | $42,542 |
| 2016 | $2,246 | $51,501 | $8,959 | $42,542 |
| 2015 | $2,261 | $51,501 | $8,959 | $42,542 |
| 2014 | $2,259 | $51,501 | $8,959 | $42,542 |
| 2013 | -- | $51,501 | $8,958 | $42,542 |
Source: Public Records
Map
Nearby Homes
- 1301 Riverside Ave
- 0 Beville St
- 515 Summit St
- 1408 Bethune St
- 2312 Spurgeon St
- 2120 Tebeau St
- 2022 Pioneer St
- 904 Golfview Dr
- 1504 Habersham Dr
- .22 Alice St
- 2202 Pioneer St
- 00 Pineview Dr
- 0 Pineview Dr
- 511 Riverside Dr
- 2509 Tebeau St
- 1219 Clough St
- 607 Linden Dr
- 1410 Hazel St
- 301 Riverside Dr
- 1405 Grove Ave