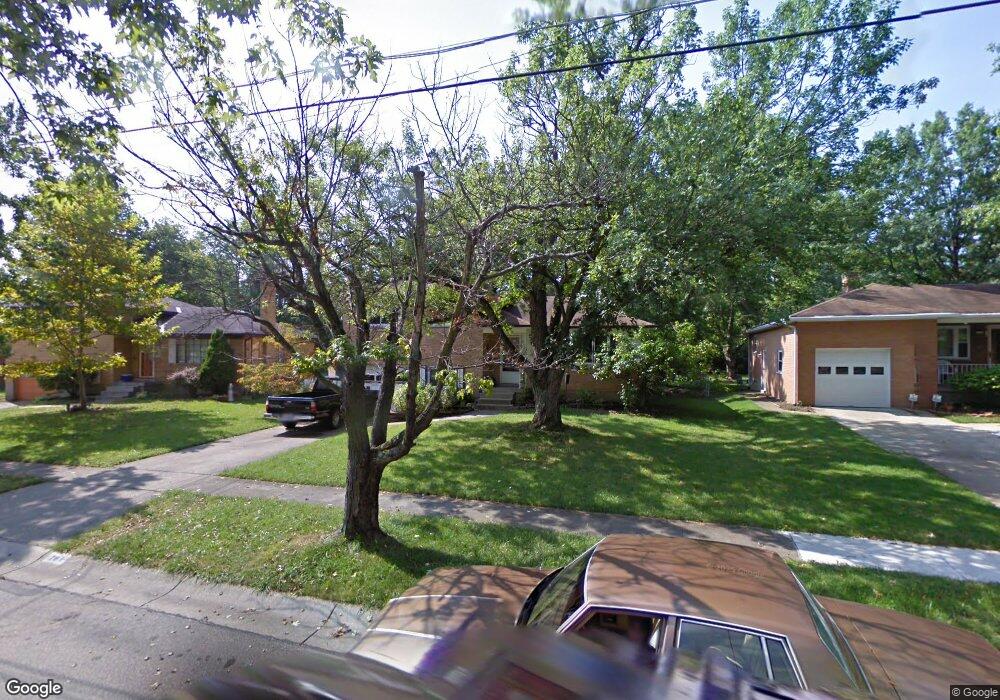
701 Cascade Rd Cincinnati, OH 45240
Estimated Value: $220,000 - $250,000
3
Beds
2
Baths
1,760
Sq Ft
$131/Sq Ft
Est. Value
About This Home
This home is located at 701 Cascade Rd, Cincinnati, OH 45240 and is currently estimated at $231,098, approximately $131 per square foot. 701 Cascade Rd is a home located in Hamilton County with nearby schools including Calvary Academy- The and St Gabriel Consolidated School.
Ownership History
Date
Name
Owned For
Owner Type
Purchase Details
Closed on
Mar 15, 2006
Sold by
Johnson Todd A and Johnson Brenda M
Bought by
Ingram Christopher J and Goertz Naomi J
Current Estimated Value
Home Financials for this Owner
Home Financials are based on the most recent Mortgage that was taken out on this home.
Original Mortgage
$112,500
Outstanding Balance
$62,728
Interest Rate
6.33%
Mortgage Type
Fannie Mae Freddie Mac
Estimated Equity
$168,370
Purchase Details
Closed on
Aug 3, 1999
Sold by
Hoop Charles R and Hoop Betty J
Bought by
Johnson Todd A
Home Financials for this Owner
Home Financials are based on the most recent Mortgage that was taken out on this home.
Original Mortgage
$100,900
Interest Rate
7.7%
Mortgage Type
FHA
Create a Home Valuation Report for This Property
The Home Valuation Report is an in-depth analysis detailing your home's value as well as a comparison with similar homes in the area
Home Values in the Area
Average Home Value in this Area
Purchase History
| Date | Buyer | Sale Price | Title Company |
|---|---|---|---|
| Ingram Christopher J | $125,000 | None Available | |
| Johnson Todd A | $101,000 | Partners Title Agency Inc |
Source: Public Records
Mortgage History
| Date | Status | Borrower | Loan Amount |
|---|---|---|---|
| Open | Ingram Christopher J | $112,500 | |
| Previous Owner | Johnson Todd A | $100,900 |
Source: Public Records
Tax History
| Year | Tax Paid | Tax Assessment Tax Assessment Total Assessment is a certain percentage of the fair market value that is determined by local assessors to be the total taxable value of land and additions on the property. | Land | Improvement |
|---|---|---|---|---|
| 2025 | $3,110 | $52,857 | $10,703 | $42,154 |
| 2024 | $3,027 | $52,857 | $10,703 | $42,154 |
| 2023 | $3,069 | $52,857 | $10,703 | $42,154 |
| 2022 | $2,928 | $38,171 | $9,520 | $28,651 |
| 2021 | $2,859 | $38,171 | $9,520 | $28,651 |
| 2020 | $2,896 | $38,171 | $9,520 | $28,651 |
| 2019 | $2,749 | $31,812 | $7,935 | $23,877 |
| 2018 | $2,755 | $31,812 | $7,935 | $23,877 |
| 2017 | $2,650 | $31,812 | $7,935 | $23,877 |
| 2016 | $2,548 | $29,974 | $8,372 | $21,602 |
| 2015 | $2,365 | $29,974 | $8,372 | $21,602 |
| 2014 | $2,183 | $29,974 | $8,372 | $21,602 |
| 2013 | $2,250 | $31,553 | $8,813 | $22,740 |
Source: Public Records
Map
Nearby Homes
- 567 Brunswick Dr
- 693 Carlsbad Rd
- 749 Converse Dr
- 835 Cascade Rd
- 37 Hayden Dr
- 11073 Corona Rd
- 77 Handel Ln
- 10619 Deauville Rd
- 68 Gambier Cir
- 162 Sheffield Rd
- 30 Gambier Cir
- 5 Imbler Dr
- 11131 Hanover Rd
- 6 Chalmers Ct
- 11 Ashby St
- 11 Dewitt Ct
- 9 Dewitt Ct
- 7 Dewitt Ct
- 10184 Lochcrest Dr
- 10219 Winstead Ln