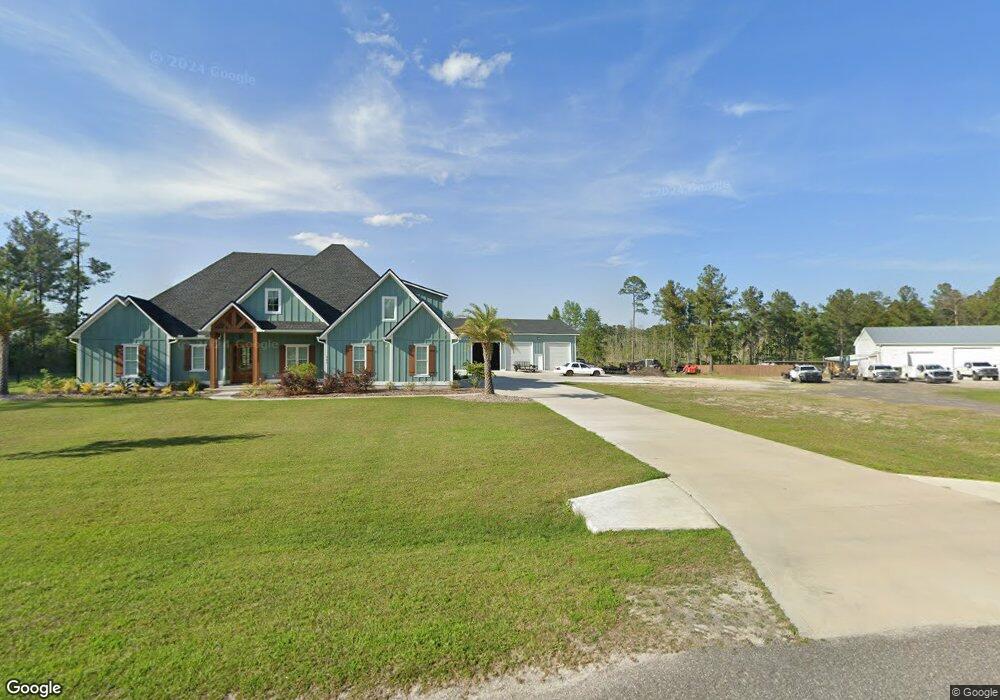
701 Catfish Landing Cir Kingsland, GA 31548
Estimated Value: $538,000 - $809,821
3
Beds
4
Baths
2,985
Sq Ft
$222/Sq Ft
Est. Value
About This Home
This home is located at 701 Catfish Landing Cir, Kingsland, GA 31548 and is currently estimated at $663,205, approximately $222 per square foot. 701 Catfish Landing Cir is a home with nearby schools including Kingsland Elementary School, Camden Middle School, and Camden County High School.
Ownership History
Date
Name
Owned For
Owner Type
Purchase Details
Closed on
Apr 7, 2021
Sold by
Barlow Christopher W
Bought by
Barlow Christopher W and Behrman Sarah
Current Estimated Value
Home Financials for this Owner
Home Financials are based on the most recent Mortgage that was taken out on this home.
Original Mortgage
$401,600
Outstanding Balance
$362,886
Interest Rate
3.05%
Mortgage Type
New Conventional
Estimated Equity
$300,319
Purchase Details
Closed on
Apr 30, 2019
Sold by
Thrift Construction Inc
Bought by
Scott H Johnson Construction Inc
Purchase Details
Closed on
Dec 7, 2017
Sold by
James Atkinson
Bought by
Thrift Construction Inc
Purchase Details
Closed on
Jun 14, 2016
Sold by
The Landings At Catfish Cr
Bought by
Atkinson James
Purchase Details
Closed on
Jul 27, 2006
Sold by
Not Provided
Bought by
Royal Oaks Development Venture
Purchase Details
Closed on
Jul 26, 2006
Sold by
Not Provided
Bought by
Royal Oaks Development Venture
Create a Home Valuation Report for This Property
The Home Valuation Report is an in-depth analysis detailing your home's value as well as a comparison with similar homes in the area
Home Values in the Area
Average Home Value in this Area
Purchase History
| Date | Buyer | Sale Price | Title Company |
|---|---|---|---|
| Barlow Christopher W | -- | -- | |
| Scott H Johnson Construction Inc | $40,000 | -- | |
| Thrift Construction Inc | $26,000 | -- | |
| Atkinson James | $20,000 | -- | |
| Royal Oaks Development Venture | -- | -- | |
| Royal Oaks Development Venture | -- | -- |
Source: Public Records
Mortgage History
| Date | Status | Borrower | Loan Amount |
|---|---|---|---|
| Open | Barlow Christopher W | $401,600 |
Source: Public Records
Tax History Compared to Growth
Tax History
| Year | Tax Paid | Tax Assessment Tax Assessment Total Assessment is a certain percentage of the fair market value that is determined by local assessors to be the total taxable value of land and additions on the property. | Land | Improvement |
|---|---|---|---|---|
| 2024 | $6,598 | $302,245 | $20,000 | $282,245 |
| 2023 | $6,811 | $273,297 | $14,000 | $259,297 |
| 2022 | $4,970 | $234,792 | $14,000 | $220,792 |
| 2021 | $4,019 | $124,528 | $10,000 | $114,528 |
| 2020 | $266 | $8,000 | $8,000 | $0 |
| 2019 | $268 | $8,000 | $8,000 | $0 |
| 2018 | $240 | $8,000 | $8,000 | $0 |
| 2017 | $227 | $7,403 | $7,403 | $0 |
| 2016 | $30 | $7,403 | $7,403 | $0 |
| 2015 | $220 | $7,403 | $7,403 | $0 |
| 2014 | -- | $7,403 | $7,403 | $0 |
Source: Public Records
Map
Nearby Homes
- 752 Catfish Landing Cir
- 216 Landing Blvd
- 0 Ashton Ln Unit 1650886
- 524 Hide Away Lake Loop
- 524 Hide-A-way Lake Loop
- 522 Hide-A-way Lake Loop
- 240 Hide Away Lake Dr
- 508 Hide-A-way Lake Loop
- 231 Hide Away Lake Dr
- 100 Hollow Point Trail
- 233 S Sheffield St
- 246 W Peach Ave
- 145 W Woodhaven Dr
- 114 Pineneedle Ct
- 195 W Magnolia Ave
- 31.17 Ac Hollow Point Trail
- 135 W Woodhaven Dr
- 213 Merriwood Cir
- 208 Foxwood Dr
- 0 W S Henrietta St
- 715 Catfish Landing Cir
- 682 Catfish Landing Cir
- 641 Catfish Landing Cir
- 640 Catfish Landing Cir
- 801 Catfish Landing Cir
- 820 Catfish Landing Cir
- 548 Catfish Landing Cir
- 839 Catfish Landing Cir
- 575 Catfish Landing Cir
- 867 Catfish Landing Cir
- 511 Catfish Landing Cir
- 932 Catfish Landing Cir
- 972 Catfish Landing Cir
- 475 Catfish Landing Cir
- 24 Blackwater Ct
- 48 Blackwater Ct
- 32 Blackwater Ct
- 1060 Catfish Landing Cir
- 0 Blackwater Ct Unit 8343360
- 0 Blackwater Ct Unit 23 8008949