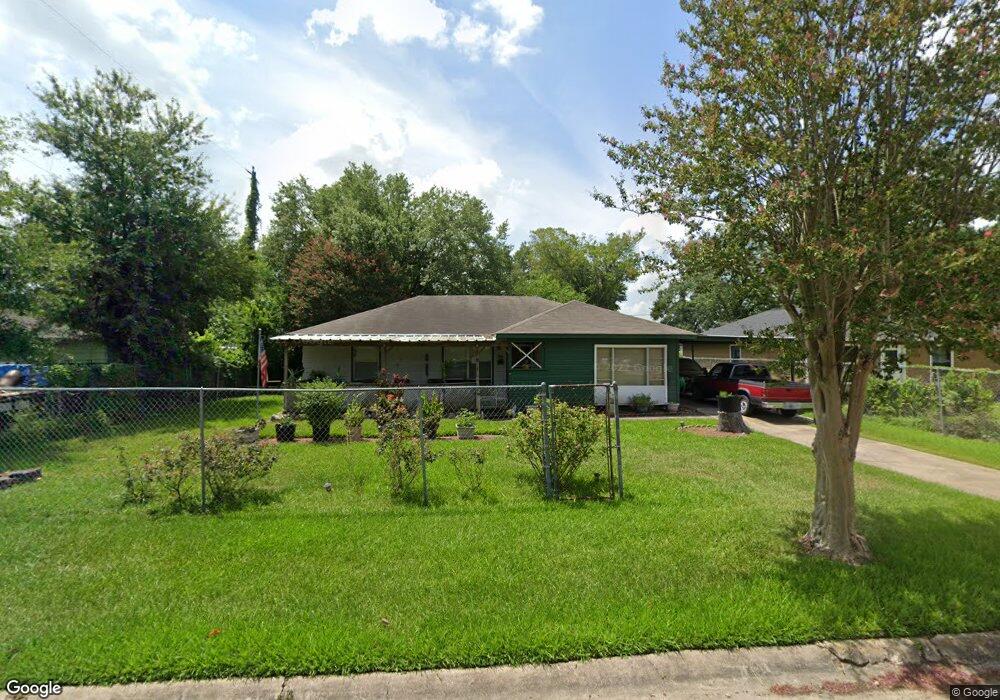
701 Champs St Channelview, TX 77530
Estimated Value: $168,066 - $195,000
2
Beds
1
Bath
1,182
Sq Ft
$154/Sq Ft
Est. Value
About This Home
This home is located at 701 Champs St, Channelview, TX 77530 and is currently estimated at $181,767, approximately $153 per square foot. 701 Champs St is a home located in Harris County with nearby schools including Channelview High School and Family Christian Academy.
Ownership History
Date
Name
Owned For
Owner Type
Purchase Details
Closed on
Dec 8, 2014
Sold by
Passmore Willard
Bought by
Mccormick Gerald Allen and Mccormick Terry Lee
Current Estimated Value
Home Financials for this Owner
Home Financials are based on the most recent Mortgage that was taken out on this home.
Original Mortgage
$53,000
Interest Rate
3.99%
Mortgage Type
Purchase Money Mortgage
Purchase Details
Closed on
Dec 10, 2002
Sold by
Jordan Deborah Sherene Wanke
Bought by
Passmore Willard
Home Financials for this Owner
Home Financials are based on the most recent Mortgage that was taken out on this home.
Original Mortgage
$45,000
Interest Rate
6.05%
Purchase Details
Closed on
Jul 15, 1998
Sold by
Williams James Odom and Williams Jacqueline Marie
Bought by
Rowlett Irma Patricia
Home Financials for this Owner
Home Financials are based on the most recent Mortgage that was taken out on this home.
Original Mortgage
$34,000
Interest Rate
7.09%
Create a Home Valuation Report for This Property
The Home Valuation Report is an in-depth analysis detailing your home's value as well as a comparison with similar homes in the area
Home Values in the Area
Average Home Value in this Area
Purchase History
| Date | Buyer | Sale Price | Title Company |
|---|---|---|---|
| Mccormick Gerald Allen | -- | None Available | |
| Passmore Willard | -- | Texas American Title Company | |
| Rowlett Irma Patricia | -- | Texas American Title Company |
Source: Public Records
Mortgage History
| Date | Status | Borrower | Loan Amount |
|---|---|---|---|
| Closed | Mccormick Gerald Allen | $53,000 | |
| Previous Owner | Passmore Willard | $45,000 | |
| Previous Owner | Rowlett Irma Patricia | $34,000 |
Source: Public Records
Tax History Compared to Growth
Tax History
| Year | Tax Paid | Tax Assessment Tax Assessment Total Assessment is a certain percentage of the fair market value that is determined by local assessors to be the total taxable value of land and additions on the property. | Land | Improvement |
|---|---|---|---|---|
| 2025 | $181 | $152,680 | $34,504 | $118,176 |
| 2024 | $181 | $150,620 | $34,504 | $116,116 |
| 2023 | $181 | $160,622 | $34,504 | $126,118 |
| 2022 | $2,883 | $140,415 | $34,504 | $105,911 |
| 2021 | $2,728 | $112,595 | $34,504 | $78,091 |
| 2020 | $2,677 | $104,260 | $31,478 | $72,782 |
| 2019 | $2,504 | $104,260 | $31,478 | $72,782 |
| 2018 | $84 | $86,658 | $24,214 | $62,444 |
| 2017 | $2,256 | $86,658 | $24,214 | $62,444 |
| 2016 | $2,051 | $80,708 | $18,160 | $62,548 |
| 2015 | $1,339 | $70,907 | $11,501 | $59,406 |
| 2014 | $1,339 | $61,198 | $11,501 | $49,697 |
Source: Public Records
Map
Nearby Homes
- 702 Norell St
- 818 Mccardell St
- 822 Woodhue St
- 714 Horncastle St
- 15603 N Brentwood St
- 15506 Vonnett St
- 523 Sheldon Rd
- 815 Spates St
- 814 Kilpatrick St
- 16023 Ridlon St
- 16032 1/2 Ridlon St
- 743 Knob Hollow St
- 803 Knob Hollow St
- 722 Dell Dale St
- 15418 Lost Lariat Ct
- 15418 Cielo Azul Ln
- 431 Crockett St
- 1230 Baja Vista Way
- 910 Calm Creek Ct
- 15225 Woodforest Blvd