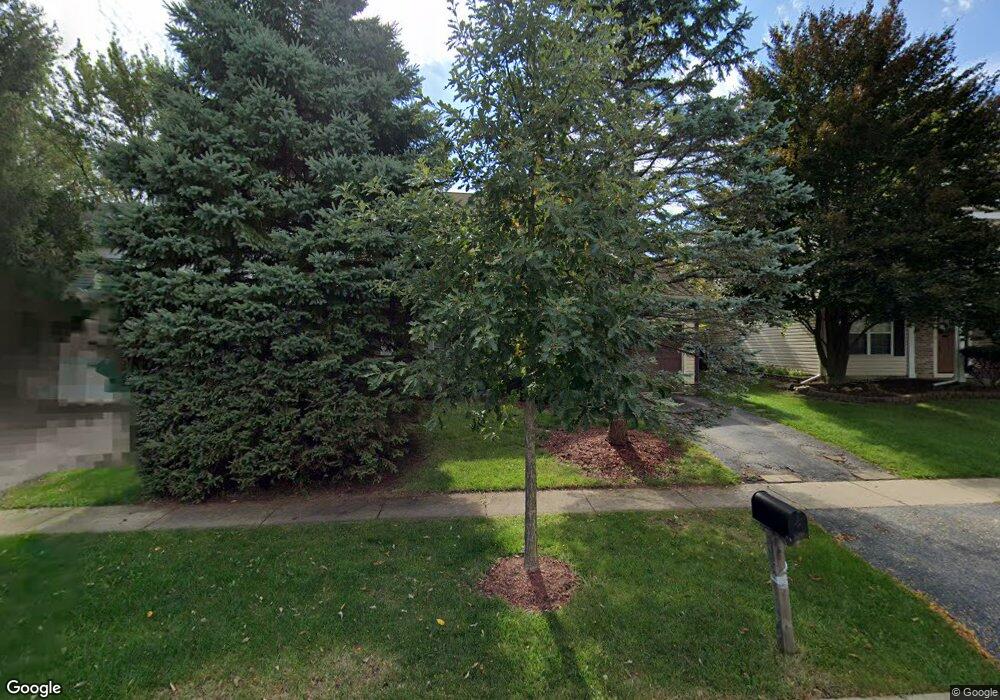
701 Cherry Valley Rd Vernon Hills, IL 60061
Estimated Value: $366,000 - $409,000
3
Beds
2
Baths
1,600
Sq Ft
$242/Sq Ft
Est. Value
About This Home
This home is located at 701 Cherry Valley Rd, Vernon Hills, IL 60061 and is currently estimated at $387,542, approximately $242 per square foot. 701 Cherry Valley Rd is a home located in Lake County with nearby schools including Country Meadows Elementary School, Woodlawn Middle School, and Adlai E Stevenson High School.
Ownership History
Date
Name
Owned For
Owner Type
Purchase Details
Closed on
Feb 22, 2006
Sold by
Graham Lila M
Bought by
Rut Josef and Rut Jolanta
Current Estimated Value
Home Financials for this Owner
Home Financials are based on the most recent Mortgage that was taken out on this home.
Original Mortgage
$185,600
Outstanding Balance
$100,862
Interest Rate
5.62%
Mortgage Type
Purchase Money Mortgage
Estimated Equity
$286,680
Purchase Details
Closed on
Aug 27, 1999
Sold by
Koning John Todd and Koning Marcy
Bought by
Graham Lila M
Home Financials for this Owner
Home Financials are based on the most recent Mortgage that was taken out on this home.
Original Mortgage
$110,000
Interest Rate
7.77%
Purchase Details
Closed on
Jun 26, 1998
Sold by
Pesola Rocco A and Pesola Gayle L
Bought by
Koning John Todd and Koning Marcy
Home Financials for this Owner
Home Financials are based on the most recent Mortgage that was taken out on this home.
Original Mortgage
$117,600
Interest Rate
7.15%
Create a Home Valuation Report for This Property
The Home Valuation Report is an in-depth analysis detailing your home's value as well as a comparison with similar homes in the area
Home Values in the Area
Average Home Value in this Area
Purchase History
| Date | Buyer | Sale Price | Title Company |
|---|---|---|---|
| Rut Josef | $232,000 | None Available | |
| Graham Lila M | $157,000 | First American Title | |
| Koning John Todd | $147,000 | -- |
Source: Public Records
Mortgage History
| Date | Status | Borrower | Loan Amount |
|---|---|---|---|
| Open | Rut Josef | $185,600 | |
| Previous Owner | Graham Lila M | $110,000 | |
| Previous Owner | Koning John Todd | $117,600 |
Source: Public Records
Tax History Compared to Growth
Tax History
| Year | Tax Paid | Tax Assessment Tax Assessment Total Assessment is a certain percentage of the fair market value that is determined by local assessors to be the total taxable value of land and additions on the property. | Land | Improvement |
|---|---|---|---|---|
| 2024 | $6,792 | $90,666 | $19,678 | $70,988 |
| 2023 | $6,762 | $85,550 | $18,568 | $66,982 |
| 2022 | $6,762 | $80,394 | $17,449 | $62,945 |
| 2021 | $6,526 | $79,527 | $17,261 | $62,266 |
| 2020 | $6,407 | $79,798 | $17,320 | $62,478 |
| 2019 | $6,736 | $79,504 | $17,256 | $62,248 |
| 2018 | $5,860 | $70,707 | $17,056 | $53,651 |
| 2017 | $5,788 | $69,057 | $16,658 | $52,399 |
| 2016 | $5,572 | $66,127 | $15,951 | $50,176 |
| 2015 | $5,434 | $61,841 | $14,917 | $46,924 |
| 2014 | $5,106 | $58,699 | $16,021 | $42,678 |
| 2012 | $5,072 | $58,817 | $16,053 | $42,764 |
Source: Public Records
Map
Nearby Homes
- 210 E Lakeside Dr
- 713 N Lakeside Dr
- 717 N Lakeside Dr
- 835 Waterview Cir Unit 4
- 835 Waterview Cir Unit 2
- 35 Charles Ct
- 820 N Lakeside Dr Unit 2D
- 229 W Court of Shorewood Unit 3B
- 239 W Ct of Shorewood Unit 1B
- 126 S Fiore Pkwy
- 67 Shelby Ct
- 190 Southgate Dr
- 0 Endwood Dr
- 234 Us Highway 45
- 382 Birchwood Ct Unit 82C
- 361 Ashwood Ct Unit 75D
- 128 Lilly Ct
- 6421 Collier Cir
- 336 Westwood Ct Unit 42D
- 15 Tanwood Ct Unit 52B
- 699 Cherry Valley Rd
- 703 Cherry Valley Rd
- 697 Cherry Valley Rd
- 705 Cherry Valley Rd
- 301 Court of Elm
- 707 Cherry Valley Rd
- 695 Cherry Valley Rd
- 303 Court of Elm
- 709 Court of Spruce
- 700 Cherry Valley Rd
- 705 Court of Spruce
- 705 Court of Spruce
- 705 Court of Spruce Unit 5
- 704 Cherry Valley Rd
- 701 Court of Spruce
- 701 Court of Spruce Unit 5
- 701 Court of Spruce Unit 2
- 701 Spruce Ct Unit 1
- 701 Spruce Ct Unit 4
- 701 Spruce Ct Unit 2