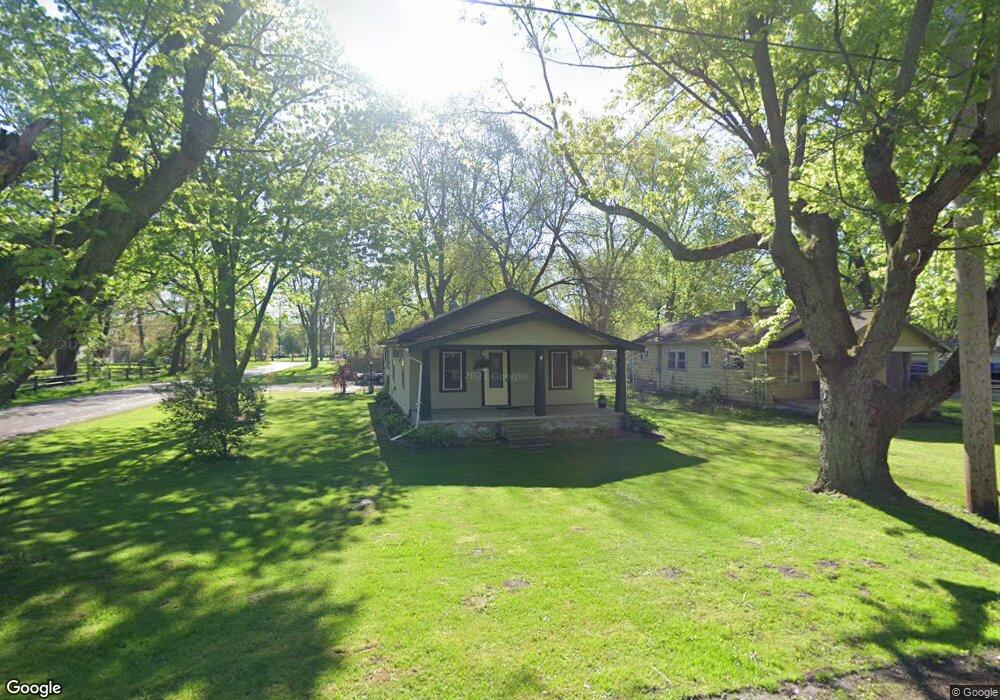
701 Dorcas St Holland, OH 43528
Estimated Value: $120,000 - $136,224
2
Beds
1
Bath
836
Sq Ft
$151/Sq Ft
Est. Value
About This Home
This home is located at 701 Dorcas St, Holland, OH 43528 and is currently estimated at $126,306, approximately $151 per square foot. 701 Dorcas St is a home located in Lucas County with nearby schools including Holland Elementary School, Springfield Middle School, and Springfield High School.
Ownership History
Date
Name
Owned For
Owner Type
Purchase Details
Closed on
Nov 6, 2020
Sold by
Farquharson Trisha and Farquharson Trisha
Bought by
King Kelly and King Donald
Current Estimated Value
Home Financials for this Owner
Home Financials are based on the most recent Mortgage that was taken out on this home.
Original Mortgage
$78,551
Outstanding Balance
$70,025
Interest Rate
2.9%
Mortgage Type
FHA
Estimated Equity
$56,281
Purchase Details
Closed on
Nov 1, 2012
Sold by
Jswass Llc
Bought by
Dak Investments Llc
Purchase Details
Closed on
Jul 25, 2005
Sold by
Holloway Robert L
Bought by
Farquharson John L
Home Financials for this Owner
Home Financials are based on the most recent Mortgage that was taken out on this home.
Original Mortgage
$82,980
Interest Rate
5.74%
Mortgage Type
Fannie Mae Freddie Mac
Purchase Details
Closed on
May 5, 1994
Sold by
Holloway Pauline
Purchase Details
Closed on
May 10, 1988
Sold by
Holloway Holloway L L and Holloway P
Create a Home Valuation Report for This Property
The Home Valuation Report is an in-depth analysis detailing your home's value as well as a comparison with similar homes in the area
Home Values in the Area
Average Home Value in this Area
Purchase History
| Date | Buyer | Sale Price | Title Company |
|---|---|---|---|
| King Kelly | -- | First American Title | |
| Dak Investments Llc | $13,400 | None Available | |
| Farquharson John L | $83,000 | -- | |
| -- | -- | -- | |
| -- | -- | -- |
Source: Public Records
Mortgage History
| Date | Status | Borrower | Loan Amount |
|---|---|---|---|
| Open | King Kelly | $78,551 | |
| Previous Owner | Farquharson John L | $82,980 |
Source: Public Records
Tax History Compared to Growth
Tax History
| Year | Tax Paid | Tax Assessment Tax Assessment Total Assessment is a certain percentage of the fair market value that is determined by local assessors to be the total taxable value of land and additions on the property. | Land | Improvement |
|---|---|---|---|---|
| 2024 | $1,257 | $41,055 | $13,300 | $27,755 |
| 2023 | $1,986 | $28,210 | $11,200 | $17,010 |
| 2022 | $1,981 | $28,210 | $11,200 | $17,010 |
| 2021 | $1,864 | $28,210 | $11,200 | $17,010 |
| 2020 | $1,687 | $23,100 | $9,030 | $14,070 |
| 2019 | $1,649 | $23,100 | $9,030 | $14,070 |
| 2018 | $1,707 | $23,100 | $9,030 | $14,070 |
| 2017 | $1,594 | $20,825 | $8,085 | $12,740 |
| 2016 | $1,608 | $59,500 | $23,100 | $36,400 |
| 2015 | $1,789 | $59,500 | $23,100 | $36,400 |
| 2014 | $1,406 | $20,020 | $7,770 | $12,250 |
| 2013 | $1,406 | $20,020 | $7,770 | $12,250 |
Source: Public Records
Map
Nearby Homes
- 642 Diana Dr
- 508 Crystal Lake Dr
- 640 Quigley St
- 426 Cheswick Rd
- 343 S Mccord Rd
- 352 Cheswick St
- 324 Harefoote St
- 319 S Mccord Rd
- 6855 Wharton Rd
- 217 Pebble Beach Dr
- 7139 Springfield Dr
- 6607 Hill Ave
- 617 & 621 S Mccord Rd
- 6130 White Oak Dr
- 7331 Witherby Ct
- 6339 Hill Ave
- 820 Weatherstone Rd
- 6043 Reo St
- 127 N Dorcas Rd
- 1054 Clark St