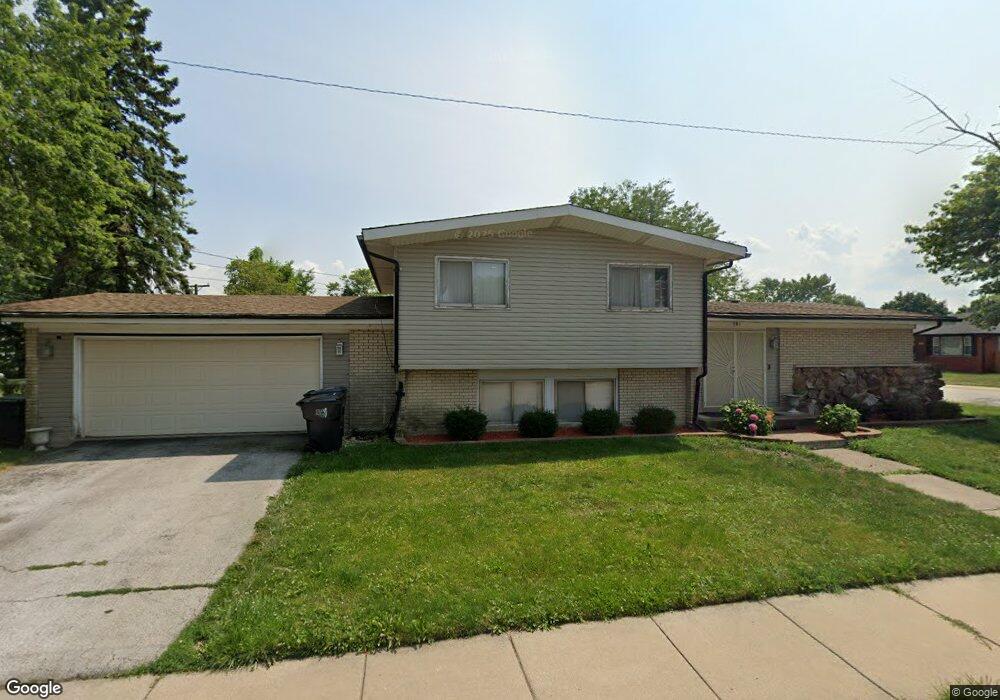
701 E 164th Place South Holland, IL 60473
Central District NeighborhoodEstimated Value: $197,000 - $238,000
3
Beds
2
Baths
1,192
Sq Ft
$188/Sq Ft
Est. Value
About This Home
This home is located at 701 E 164th Place, South Holland, IL 60473 and is currently estimated at $224,121, approximately $188 per square foot. 701 E 164th Place is a home located in Cook County with nearby schools including Greenwood Elementary School, Mckinley Elementary School, and Mckinley Jr High School.
Ownership History
Date
Name
Owned For
Owner Type
Purchase Details
Closed on
Oct 23, 2012
Sold by
Grisby Cornelius R and Conwell Veronica
Bought by
Grisby Cornelius R
Current Estimated Value
Home Financials for this Owner
Home Financials are based on the most recent Mortgage that was taken out on this home.
Original Mortgage
$88,000
Outstanding Balance
$61,052
Interest Rate
3.55%
Mortgage Type
New Conventional
Estimated Equity
$163,069
Purchase Details
Closed on
May 28, 1997
Sold by
Adomaitis Edward A and Adomaitis Debra
Bought by
Grisby Cornelius R and Conwell Veronica
Home Financials for this Owner
Home Financials are based on the most recent Mortgage that was taken out on this home.
Original Mortgage
$105,800
Interest Rate
8.13%
Mortgage Type
FHA
Create a Home Valuation Report for This Property
The Home Valuation Report is an in-depth analysis detailing your home's value as well as a comparison with similar homes in the area
Home Values in the Area
Average Home Value in this Area
Purchase History
| Date | Buyer | Sale Price | Title Company |
|---|---|---|---|
| Grisby Cornelius R | -- | -- | |
| Grisby Cornelius R | -- | -- | |
| Grisby Cornelius R | -- | -- | |
| Grisby Cornelius R | $115,000 | Attorneys Natl Title Network |
Source: Public Records
Mortgage History
| Date | Status | Borrower | Loan Amount |
|---|---|---|---|
| Open | Grisby Cornelius R | $88,000 | |
| Closed | Grisby Cornelius R | $88,000 | |
| Previous Owner | Grisby Cornelius R | $105,800 |
Source: Public Records
Tax History Compared to Growth
Tax History
| Year | Tax Paid | Tax Assessment Tax Assessment Total Assessment is a certain percentage of the fair market value that is determined by local assessors to be the total taxable value of land and additions on the property. | Land | Improvement |
|---|---|---|---|---|
| 2024 | $8,131 | $21,000 | $3,494 | $17,506 |
| 2023 | $5,943 | $21,000 | $3,494 | $17,506 |
| 2022 | $5,943 | $13,491 | $2,995 | $10,496 |
| 2021 | $5,758 | $13,490 | $2,994 | $10,496 |
| 2020 | $5,553 | $13,490 | $2,994 | $10,496 |
| 2019 | $4,507 | $11,685 | $2,662 | $9,023 |
| 2018 | $4,300 | $11,685 | $2,662 | $9,023 |
| 2017 | $4,234 | $11,685 | $2,662 | $9,023 |
| 2016 | $4,283 | $11,125 | $2,495 | $8,630 |
| 2015 | $4,085 | $11,125 | $2,495 | $8,630 |
| 2014 | $4,009 | $11,125 | $2,495 | $8,630 |
| 2013 | $4,133 | $12,188 | $2,495 | $9,693 |
Source: Public Records
Map
Nearby Homes
- 606 E 164th Place
- 16419 School St
- 16506 School St
- 16417 School St
- 505 Betty Ln
- 16601 Langley Ave
- 16411 Claire Ln
- 16631 Langley Ave
- 520 E 166th St
- 664 E 163rd St
- 16645 Cottage Grove Ave
- 529 E 166th Place
- 16646 Maryland Ave
- 16535 Elm Ct
- 429 E 164th Place
- 16664 Maryland Ave
- 480 E 163rd St
- 16550 Elm Ct
- 16211 Joyce Cir
- 943 E 164th Ct
- 16431 Evans Ave
- 703 E 164th Place
- 700 E 164th Place
- 16433 Evans Ave
- 16426 Evans Ave
- 16511 Evans Ave
- 705 E 164th Place
- 702 E 164th Place
- 709 Caryn Cir
- 714 Caryn Cir
- 16425 Evans Ave
- 610 E 164th Place
- 16502 Evans Ave
- 16515 Evans Ave
- 16506 Evans Ave
- 605 E 164th Place
- 608 E 164th Place
- 16423 Evans Ave
- 16512 Evans Ave
- 16521 Evans Ave