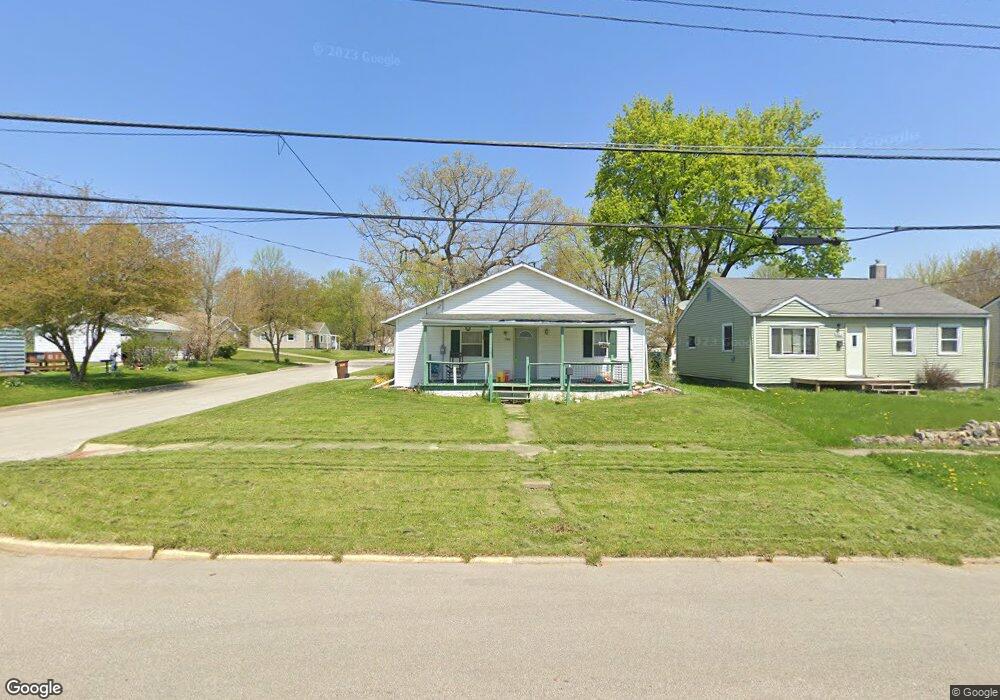
701 E Broad St Angola, IN 46703
Estimated Value: $94,000 - $154,000
3
Beds
1
Bath
1,740
Sq Ft
$74/Sq Ft
Est. Value
About This Home
This home is located at 701 E Broad St, Angola, IN 46703 and is currently estimated at $128,768, approximately $74 per square foot. 701 E Broad St is a home located in Steuben County with nearby schools including Angola High School and Grace Baptist Academy.
Ownership History
Date
Name
Owned For
Owner Type
Purchase Details
Closed on
Sep 1, 2017
Sold by
Wogoman
Bought by
Johnny Wogomon
Current Estimated Value
Purchase Details
Closed on
Oct 2, 2009
Sold by
The Sec Of Hud
Bought by
Shoup Michael L and Shoup Karen G
Purchase Details
Closed on
Sep 29, 2009
Sold by
Secretary Of Hud
Bought by
Shoup Michael L and Shoup Karen G
Purchase Details
Closed on
Dec 19, 2007
Sold by
Swegles Doug and Swegles Lee
Bought by
Mortgage Electronic Registration Systems
Purchase Details
Closed on
Oct 26, 2007
Sold by
Mortgage Electronic Registration Systems
Bought by
The Secretary Of Hud
Purchase Details
Closed on
Sep 27, 2007
Sold by
R L Lewis Sheriff Of Stueben Co
Bought by
Taylor Skepitimous
Purchase Details
Closed on
Jan 29, 2001
Sold by
Hayes
Bought by
Swegles Lee
Purchase Details
Closed on
Nov 17, 2000
Sold by
Hayes Theodore M and Hayes Nancy P
Bought by
Hayes Theodore M
Create a Home Valuation Report for This Property
The Home Valuation Report is an in-depth analysis detailing your home's value as well as a comparison with similar homes in the area
Home Values in the Area
Average Home Value in this Area
Purchase History
| Date | Buyer | Sale Price | Title Company |
|---|---|---|---|
| Johnny Wogomon | $68,000 | -- | |
| Shoup Michael L | $30,000 | Contract Processing And Titl | |
| Shoup Michael L | -- | None Available | |
| Mortgage Electronic Registration Systems | $60,600 | None Available | |
| The Secretary Of Hud | $57,521 | None Available | |
| Taylor Skepitimous | $60,600 | Us Bank Na | |
| Swegles Lee | $50,000 | -- | |
| Hayes Theodore M | -- | -- |
Source: Public Records
Tax History
| Year | Tax Paid | Tax Assessment Tax Assessment Total Assessment is a certain percentage of the fair market value that is determined by local assessors to be the total taxable value of land and additions on the property. | Land | Improvement |
|---|---|---|---|---|
| 2025 | $241 | $69,500 | $19,300 | $50,200 |
| 2024 | $241 | $55,400 | $18,300 | $37,100 |
| 2023 | $238 | $55,800 | $18,300 | $37,500 |
| 2022 | $205 | $54,700 | $16,400 | $38,300 |
| 2021 | $226 | $53,100 | $14,600 | $38,500 |
| 2020 | $219 | $53,100 | $14,600 | $38,500 |
| 2019 | $226 | $53,100 | $14,600 | $38,500 |
| 2018 | $237 | $53,100 | $14,600 | $38,500 |
| 2017 | $15 | $52,800 | $14,600 | $38,200 |
| 2016 | $15 | $55,800 | $14,600 | $41,200 |
| 2014 | $302 | $56,200 | $14,600 | $41,600 |
| 2013 | $302 | $56,700 | $14,600 | $42,100 |
Source: Public Records
Map
Nearby Homes
- 706 Carlin Dr
- tbd Carlin Dr
- 812 Apple Hill Way
- 308 Clyde Ave
- 700 Apple Hill Way
- 941 E Maumee St
- 615 Sarah Dr
- 600 N Washington St
- 404 N Martha St
- TBD U S 20
- 107 S West St
- 317 S West St
- 0 Redding Rd
- tbd 150 Rd
- 501 W Fox Lake Rd
- 813 Thomas Dr
- 95 W 150 S
- 00 S Bill Deller Rd
- 906 Harry Kelley Blvd
- 1810 Nolan Meadows Run
- 703 E Broad St
- 705 E Broad St
- 621 E Broad St
- 214 N Cross St
- 704 E Broad St
- 707 E Broad St
- 620 E Broad St
- 617 E Broad St
- 706 E Broad St
- 314 N Cross St
- 709 E Broad St
- 712 Randolph St
- 616 E Broad St
- 614 Randolph St
- 708 E Broad St
- 714 Randolph St
- 715 E Broad St
- 612 Randolph St
- 612 E Broad St
- 202 N Cross St
Your Personal Tour Guide
Ask me questions while you tour the home.