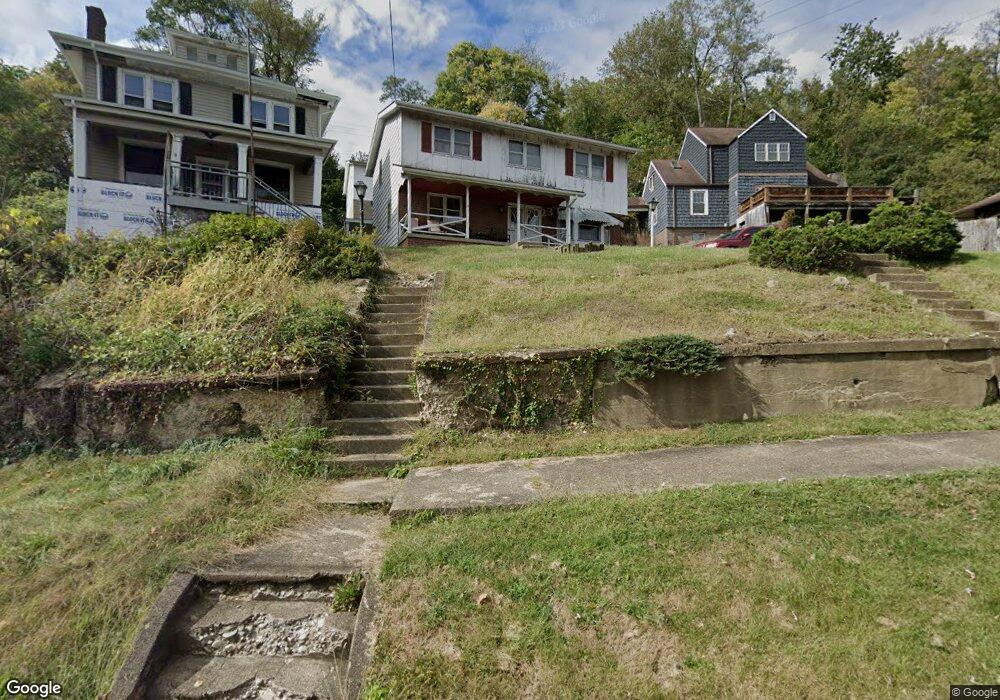
701 Elm St Martins Ferry, OH 43935
Estimated Value: $152,000 - $177,864
4
Beds
3
Baths
1,868
Sq Ft
$88/Sq Ft
Est. Value
About This Home
This home is located at 701 Elm St, Martins Ferry, OH 43935 and is currently estimated at $164,466, approximately $88 per square foot. 701 Elm St is a home located in Belmont County with nearby schools including Anna Marie Ayers Elementary School, Martins Ferry Middle School, and Martins Ferry High School.
Ownership History
Date
Name
Owned For
Owner Type
Purchase Details
Closed on
Jun 13, 2022
Sold by
Skulich Jacob N and Skulich Jenelle
Bought by
Skulich Albert A
Current Estimated Value
Purchase Details
Closed on
Apr 19, 2021
Sold by
Skulich Albert A and Skulich Iva R
Bought by
Skulich Albert A and Skulich Family Trust
Purchase Details
Closed on
Jan 1, 1987
Sold by
Skulich Albert A and Skulich Iva
Bought by
Skulich Albert A and Skulich Iva
Create a Home Valuation Report for This Property
The Home Valuation Report is an in-depth analysis detailing your home's value as well as a comparison with similar homes in the area
Home Values in the Area
Average Home Value in this Area
Purchase History
| Date | Buyer | Sale Price | Title Company |
|---|---|---|---|
| Skulich Albert A | -- | None Listed On Document | |
| Skulich Jacob N | -- | None Listed On Document | |
| Skulich Albert A | -- | None Available | |
| Skulich Albert A | -- | -- |
Source: Public Records
Tax History Compared to Growth
Tax History
| Year | Tax Paid | Tax Assessment Tax Assessment Total Assessment is a certain percentage of the fair market value that is determined by local assessors to be the total taxable value of land and additions on the property. | Land | Improvement |
|---|---|---|---|---|
| 2024 | $2,224 | $54,200 | $4,530 | $49,670 |
| 2023 | $2,181 | $48,770 | $4,530 | $44,240 |
| 2022 | $2,230 | $48,776 | $4,532 | $44,244 |
| 2021 | $2,220 | $48,776 | $4,532 | $44,244 |
| 2020 | $2,047 | $42,680 | $3,940 | $38,740 |
| 2019 | $2,049 | $42,680 | $3,940 | $38,740 |
| 2018 | $1,809 | $42,680 | $3,940 | $38,740 |
| 2017 | $1,668 | $35,260 | $4,460 | $30,800 |
| 2016 | $1,673 | $35,260 | $4,460 | $30,800 |
| 2015 | $1,507 | $35,260 | $4,460 | $30,800 |
| 2014 | $1,310 | $30,380 | $4,050 | $26,330 |
| 2013 | $1,248 | $30,380 | $4,050 | $26,330 |
Source: Public Records
Map
Nearby Homes
- 820 Mariann Dr
- 519 Clinton St
- 508 Virginia St
- 839 W Vine St
- 424 Elm St
- 525 S Zane Hwy
- 527 Virginia St
- 805 Indiana St
- 723 Pearl St
- 722 Broadway St
- 725 S 4th St
- 916 Pearl St
- 1836 Colerain Pike
- 1020 Virginia St
- 1028 Indiana St
- 1027 S Zane Hwy
- 910 Carlisle St
- 806 Carlisle St
- 1053 Broadway St
- 212 N 7th St