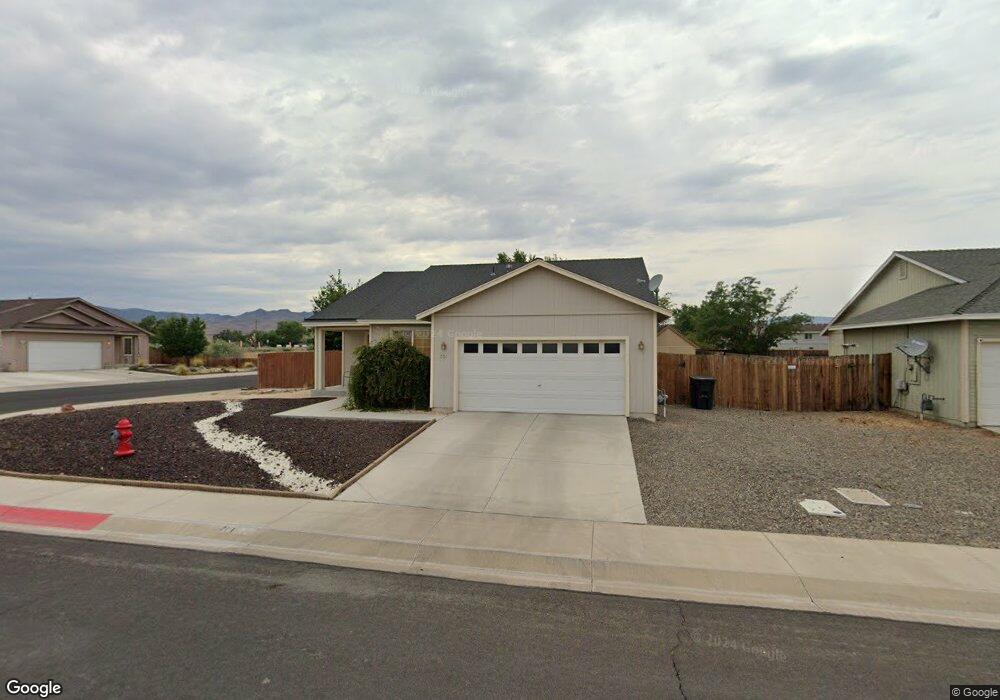
701 Fall St Fernley, NV 89408
Estimated Value: $314,000 - $363,000
3
Beds
2
Baths
1,452
Sq Ft
$241/Sq Ft
Est. Value
About This Home
This home is located at 701 Fall St, Fernley, NV 89408 and is currently estimated at $349,838, approximately $240 per square foot. 701 Fall St is a home located in Lyon County with nearby schools including Fernley Elementary School, Fernley Intermediate School, and Fernley High School.
Ownership History
Date
Name
Owned For
Owner Type
Purchase Details
Closed on
Jun 3, 2011
Sold by
Black Zachary J and Arnett Rachel D
Bought by
Schultz Leonard S and Schultz Cheryl G
Current Estimated Value
Home Financials for this Owner
Home Financials are based on the most recent Mortgage that was taken out on this home.
Original Mortgage
$60,000
Outstanding Balance
$41,363
Interest Rate
4.63%
Mortgage Type
New Conventional
Estimated Equity
$308,475
Purchase Details
Closed on
Jan 30, 2007
Sold by
Wright Edward A and Wright Tammy
Bought by
Black Zachary H and Arnett Rachel D
Home Financials for this Owner
Home Financials are based on the most recent Mortgage that was taken out on this home.
Original Mortgage
$225,000
Interest Rate
6.11%
Mortgage Type
Unknown
Create a Home Valuation Report for This Property
The Home Valuation Report is an in-depth analysis detailing your home's value as well as a comparison with similar homes in the area
Home Values in the Area
Average Home Value in this Area
Purchase History
| Date | Buyer | Sale Price | Title Company |
|---|---|---|---|
| Schultz Leonard S | $75,000 | Title Service & Escrow Co | |
| Black Zachary H | $225,000 | Ticor Title Of Nevada Inc |
Source: Public Records
Mortgage History
| Date | Status | Borrower | Loan Amount |
|---|---|---|---|
| Open | Schultz Leonard S | $60,000 | |
| Previous Owner | Black Zachary H | $225,000 |
Source: Public Records
Tax History Compared to Growth
Tax History
| Year | Tax Paid | Tax Assessment Tax Assessment Total Assessment is a certain percentage of the fair market value that is determined by local assessors to be the total taxable value of land and additions on the property. | Land | Improvement |
|---|---|---|---|---|
| 2025 | $1,435 | $102,758 | $42,000 | $60,758 |
| 2024 | $1,803 | $103,149 | $42,000 | $61,149 |
| 2023 | $1,803 | $99,275 | $42,000 | $57,275 |
| 2022 | $1,700 | $94,774 | $42,000 | $52,774 |
| 2021 | $1,687 | $89,959 | $38,500 | $51,459 |
| 2020 | $1,645 | $82,501 | $33,250 | $49,251 |
| 2019 | $1,625 | $73,817 | $26,250 | $47,567 |
| 2018 | $1,594 | $67,377 | $21,000 | $46,377 |
| 2017 | $1,592 | $60,713 | $14,350 | $46,363 |
| 2016 | $1,407 | $46,141 | $5,780 | $40,361 |
| 2015 | $1,442 | $35,374 | $5,780 | $29,594 |
| 2014 | $1,411 | $28,241 | $5,780 | $22,461 |
Source: Public Records
Map
Nearby Homes