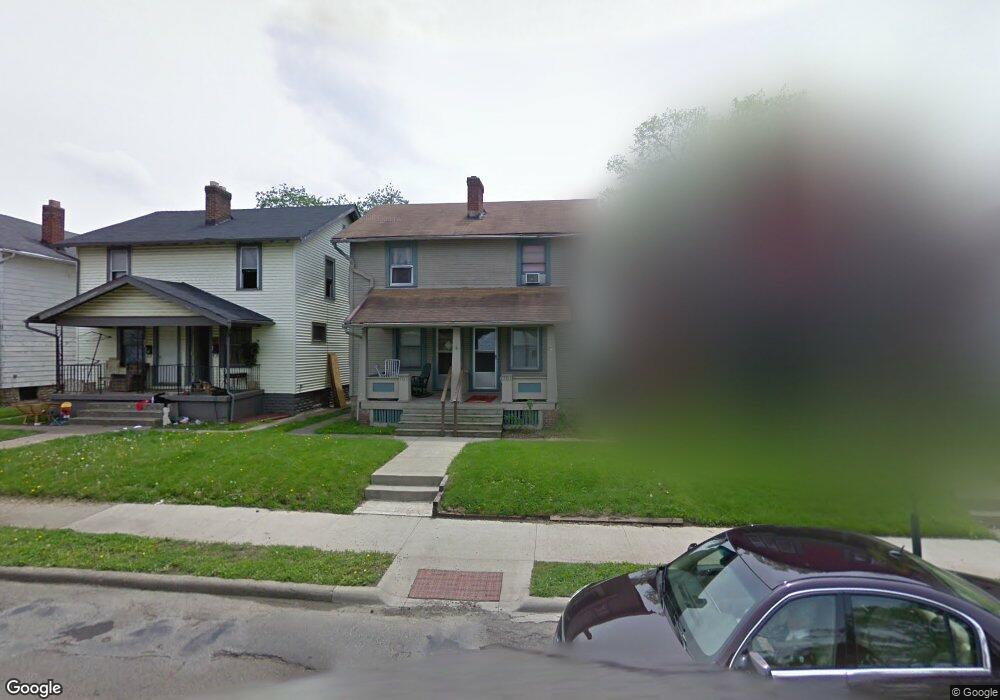
701 Frebis Ave Unit 703 Columbus, OH 43206
Vassor Village NeighborhoodEstimated Value: $188,477 - $235,000
4
Beds
2
Baths
1,568
Sq Ft
$139/Sq Ft
Est. Value
About This Home
This home is located at 701 Frebis Ave Unit 703, Columbus, OH 43206 and is currently estimated at $218,619, approximately $139 per square foot. 701 Frebis Ave Unit 703 is a home located in Franklin County with nearby schools including Lincoln Park Elementary School, South High School, and South Columbus Preparatory Academy.
Ownership History
Date
Name
Owned For
Owner Type
Purchase Details
Closed on
Feb 21, 2023
Sold by
Talley Brice L
Bought by
Lado Rentals Ltd
Current Estimated Value
Purchase Details
Closed on
Apr 15, 2016
Sold by
Kennedy Alice F
Bought by
Talley Brice L
Purchase Details
Closed on
Jan 17, 2007
Sold by
Talley Brice L
Bought by
Talley Brice L and Kennedy Alice F
Purchase Details
Closed on
Aug 29, 2002
Sold by
Wagner Helen M
Bought by
Talley Brice Lee
Home Financials for this Owner
Home Financials are based on the most recent Mortgage that was taken out on this home.
Original Mortgage
$30,000
Interest Rate
6.54%
Mortgage Type
Purchase Money Mortgage
Purchase Details
Closed on
Jan 12, 2001
Sold by
Wagner Helen M
Bought by
Wagner Helen M and Helen M Wagner Living Trust
Purchase Details
Closed on
Jan 10, 1974
Bought by
Wagner Helen M
Create a Home Valuation Report for This Property
The Home Valuation Report is an in-depth analysis detailing your home's value as well as a comparison with similar homes in the area
Home Values in the Area
Average Home Value in this Area
Purchase History
| Date | Buyer | Sale Price | Title Company |
|---|---|---|---|
| Lado Rentals Ltd | -- | Bridge Title & Escrow Services | |
| Talley Brice L | -- | Win Title Agency | |
| Talley Brice L | -- | Title Agenc | |
| Talley Brice Lee | $42,900 | -- | |
| Wagner Helen M | -- | -- | |
| Wagner Helen M | -- | -- |
Source: Public Records
Mortgage History
| Date | Status | Borrower | Loan Amount |
|---|---|---|---|
| Previous Owner | Talley Brice Lee | $30,000 |
Source: Public Records
Tax History Compared to Growth
Tax History
| Year | Tax Paid | Tax Assessment Tax Assessment Total Assessment is a certain percentage of the fair market value that is determined by local assessors to be the total taxable value of land and additions on the property. | Land | Improvement |
|---|---|---|---|---|
| 2024 | $2,527 | $52,750 | $18,940 | $33,810 |
| 2023 | $2,804 | $52,750 | $18,940 | $33,810 |
| 2022 | $1,274 | $19,110 | $4,690 | $14,420 |
| 2021 | $1,366 | $19,110 | $4,690 | $14,420 |
| 2020 | $1,169 | $19,110 | $4,690 | $14,420 |
| 2019 | $1,141 | $15,930 | $3,920 | $12,010 |
| 2018 | $961 | $15,930 | $3,920 | $12,010 |
| 2017 | $1,447 | $15,930 | $3,920 | $12,010 |
| 2016 | $1,207 | $12,010 | $3,640 | $8,370 |
| 2015 | $783 | $12,010 | $3,640 | $8,370 |
| 2014 | $734 | $12,010 | $3,640 | $8,370 |
| 2013 | $432 | $12,670 | $3,850 | $8,820 |
Source: Public Records
Map
Nearby Homes
- 706 Frebis Ave
- 721 Hanford St Unit 721-723
- 676 E Moler St
- 656 Sheldon Ave
- 621-627 E Gates St
- 609 Frebis Ave
- 0 Gilbert St
- 605 Frebis Ave
- 601 Frebis Ave
- 735-737 E Mithoff St
- 554 Hanford St
- 1263 Heyl Ave
- 563 Frebis Ave
- 650 E Mithoff St
- 739 Thurman Ave
- 798 E Mithoff St
- 693 Thurman Ave
- 1404 S Ohio Ave
- 546 Frebis Ave
- 523 Hanford St
- 701-703 Frebis Ave
- 705-707 Frebis Ave
- 705 Frebis Ave Unit 707
- 705 Frebis Ave Unit 7
- 697 Frebis Ave Unit 699
- 709 Frebis Ave
- 693 Frebis Ave Unit 695
- 693 Frebis Ave Unit 5
- 693-695 Frebis Ave
- 711 Frebis Ave
- 691 Frebis Ave
- 715-717 Frebis Ave
- 708 E Moler St
- 715 Frebis Ave Unit 717
- 714 E Moler St
- 689 Frebis Ave
- 702 E Moler St
- 720 E Moler St
- 687 Frebis Ave
- 704 Frebis Ave