Estimated Value: $408,244 - $445,000
5
Beds
3
Baths
2,632
Sq Ft
$163/Sq Ft
Est. Value
About This Home
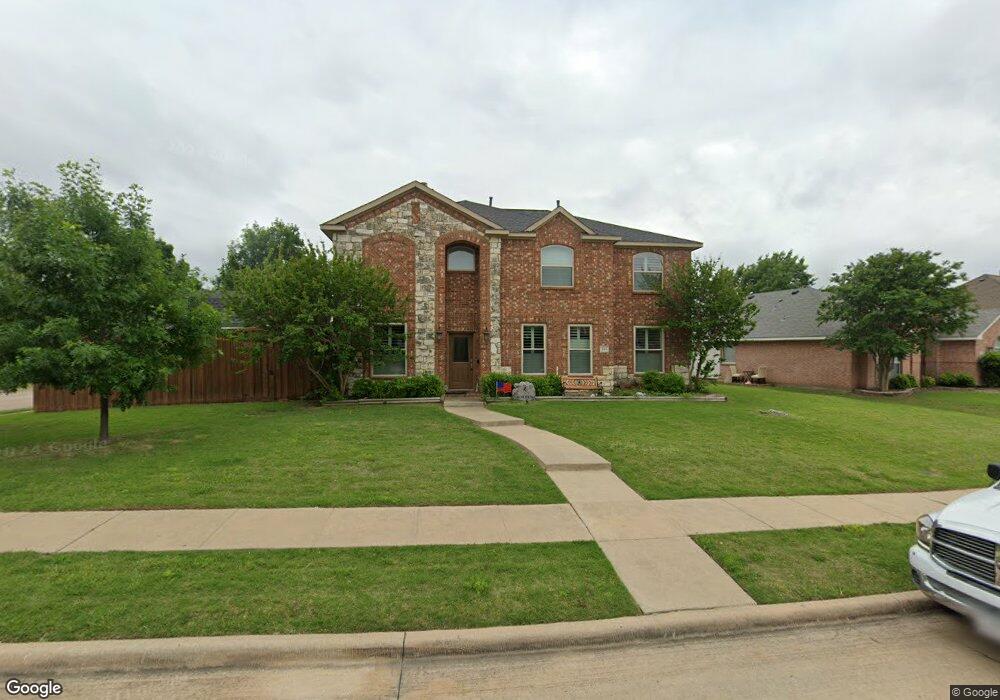
This home is located at 701 Georgetown Dr, Wylie, TX 75098 and is currently estimated at $429,811, approximately $163 per square foot. 701 Georgetown Dr is a home located in Collin County with nearby schools including T.F. Birmingham Elementary School, Frank Mcmillan Junior High School, and Davis Intermediate School.
Ownership History
Date
Name
Owned For
Owner Type
Purchase Details
Closed on
Sep 20, 2001
Sold by
Barfield Lori Sue
Bought by
Borden Edward Matthew
Current Estimated Value
Purchase Details
Closed on
Jan 31, 2001
Sold by
Ray Morris Homes Inc
Bought by
Borden Eddie and Borden Lori S
Home Financials for this Owner
Home Financials are based on the most recent Mortgage that was taken out on this home.
Original Mortgage
$170,800
Interest Rate
7.21%
Purchase Details
Closed on
Aug 16, 2000
Sold by
Wylie/1997 Llc
Bought by
Ray Morris Homes Inc
Home Financials for this Owner
Home Financials are based on the most recent Mortgage that was taken out on this home.
Original Mortgage
$143,842
Interest Rate
8.15%
Mortgage Type
Construction
Create a Home Valuation Report for This Property
The Home Valuation Report is an in-depth analysis detailing your home's value as well as a comparison with similar homes in the area
Home Values in the Area
Average Home Value in this Area
Purchase History
| Date | Buyer | Sale Price | Title Company |
|---|---|---|---|
| Borden Edward Matthew | -- | -- | |
| Borden Eddie | -- | -- | |
| Ray Morris Homes Inc | -- | -- |
Source: Public Records
Mortgage History
| Date | Status | Borrower | Loan Amount |
|---|---|---|---|
| Previous Owner | Borden Eddie | $170,800 | |
| Previous Owner | Ray Morris Homes Inc | $143,842 | |
| Closed | Borden Edward Matthew | $0 |
Source: Public Records
Tax History Compared to Growth
Tax History
| Year | Tax Paid | Tax Assessment Tax Assessment Total Assessment is a certain percentage of the fair market value that is determined by local assessors to be the total taxable value of land and additions on the property. | Land | Improvement |
|---|---|---|---|---|
| 2025 | $6,417 | $425,350 | $109,250 | $316,100 |
| 2024 | $6,417 | $390,955 | $104,500 | $293,243 |
| 2023 | $6,417 | $355,414 | $93,500 | $302,372 |
| 2022 | $6,496 | $323,104 | $93,500 | $285,583 |
| 2021 | $6,911 | $293,731 | $77,000 | $216,731 |
| 2020 | $7,054 | $284,071 | $60,500 | $223,571 |
| 2019 | $7,415 | $282,182 | $60,500 | $226,365 |
| 2018 | $6,908 | $256,529 | $60,500 | $197,041 |
| 2017 | $6,280 | $249,335 | $55,000 | $194,335 |
| 2016 | $5,891 | $222,658 | $44,000 | $178,658 |
| 2015 | $4,690 | $208,640 | $38,500 | $170,140 |
Source: Public Records
Map
Nearby Homes
- 115 Pullman Place
- 708 Andersonville Ln
- 107 N Winding Oaks Dr
- 420 W Oak St
- 314 Stephanie St
- 310 Austin Ave
- 315 Celia Cir
- 410 Oxford Dr
- 404 W Jefferson St
- 913 Chickesaw Ln
- 907 Carlton Rd
- 307 W Brown St
- 111 N Keefer Dr
- 410 N Winding Oaks Dr
- 309 Sikorsky Ct
- 205 S Cottonbelt Ave
- 300 S Cottonbelt Ave Unit 3A
- 908 Greene Way
- 902 Greene Way
- Crest Plan at The Apollo
- 703 Georgetown Dr
- 107 N Westgate Way
- 705 Georgetown Dr
- 106 N Westgate Way
- 108 N Westgate Way
- 702 Georgetown Dr
- 700 Georgetown Dr
- 105 N Westgate Way
- 704 Georgetown Dr
- 104 N Westgate Way
- 110 N Westgate Way
- 637 Casey Way
- 706 Georgetown Dr
- 102 N Westgate Way
- 112 N Westgate Way
- 707 Georgetown Dr
- 708 Georgetown Dr
- 709 Logan Ct
- 101 N Westgate Way
- 109 Pullman Place