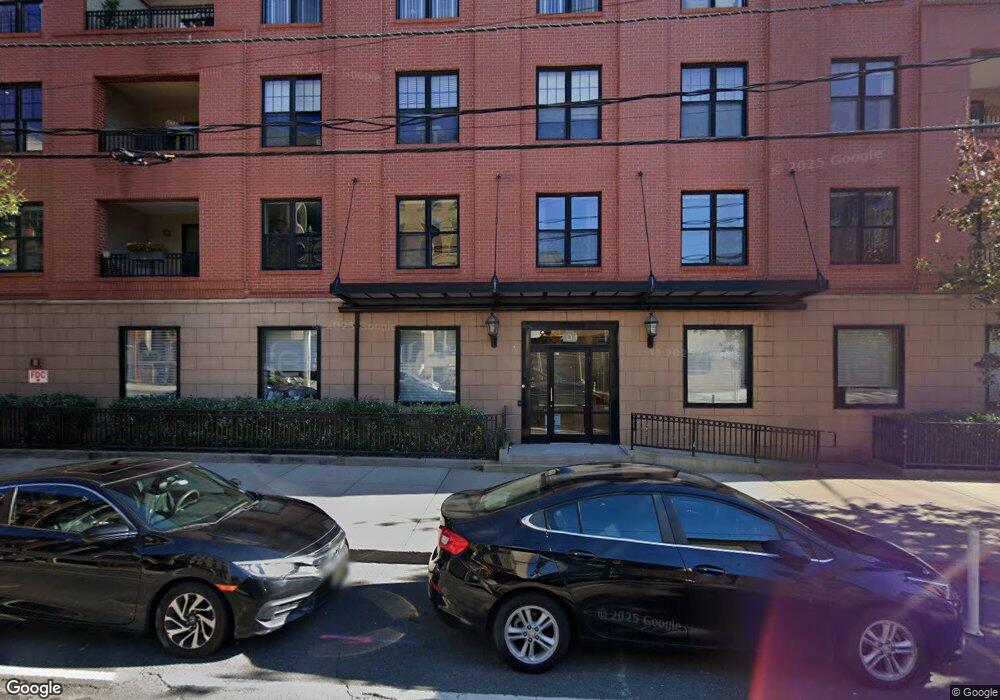
701 Grand St Unit 709 Hoboken, NJ 07030
Estimated Value: $1,101,000 - $1,363,000
2
Beds
--
Bath
1,430
Sq Ft
$841/Sq Ft
Est. Value
About This Home
This home is located at 701 Grand St Unit 709, Hoboken, NJ 07030 and is currently estimated at $1,202,018, approximately $840 per square foot. 701 Grand St Unit 709 is a home located in Hudson County with nearby schools including Hoboken High School, Hoboken Charter School, and Hoboken Catholic Academy.
Ownership History
Date
Name
Owned For
Owner Type
Purchase Details
Closed on
Jan 31, 2013
Sold by
Schechter Foligno Thomas and Schechter Foligno Laura
Bought by
Haas Alicia
Current Estimated Value
Home Financials for this Owner
Home Financials are based on the most recent Mortgage that was taken out on this home.
Original Mortgage
$541,500
Outstanding Balance
$378,013
Interest Rate
3.38%
Mortgage Type
New Conventional
Estimated Equity
$824,005
Purchase Details
Closed on
Jan 4, 2007
Sold by
Schultz Garrett and Schultz Alison
Bought by
Schechter Foligno Thomas and Schechter Foligno Laura
Purchase Details
Closed on
Jan 16, 2004
Sold by
Griffin Daniel J and Griffin Kathleen M
Bought by
Schultz Garrett and Sheehan Alison
Home Financials for this Owner
Home Financials are based on the most recent Mortgage that was taken out on this home.
Original Mortgage
$407,000
Interest Rate
3.87%
Mortgage Type
Purchase Money Mortgage
Create a Home Valuation Report for This Property
The Home Valuation Report is an in-depth analysis detailing your home's value as well as a comparison with similar homes in the area
Home Values in the Area
Average Home Value in this Area
Purchase History
| Date | Buyer | Sale Price | Title Company |
|---|---|---|---|
| Haas Alicia | $722,000 | Fidelity National Title Ins | |
| Schechter Foligno Thomas | $665,000 | None Available | |
| Schultz Garrett | $509,000 | Commonwealth Land Title Insu |
Source: Public Records
Mortgage History
| Date | Status | Borrower | Loan Amount |
|---|---|---|---|
| Open | Haas Alicia | $541,500 | |
| Previous Owner | Schultz Garrett | $407,000 |
Source: Public Records
Tax History Compared to Growth
Tax History
| Year | Tax Paid | Tax Assessment Tax Assessment Total Assessment is a certain percentage of the fair market value that is determined by local assessors to be the total taxable value of land and additions on the property. | Land | Improvement |
|---|---|---|---|---|
| 2025 | $11,947 | $676,500 | $151,200 | $525,300 |
| 2024 | $11,020 | $676,500 | $151,200 | $525,300 |
| 2023 | $11,020 | $676,500 | $151,200 | $525,300 |
| 2022 | $10,831 | $676,500 | $151,200 | $525,300 |
| 2021 | $10,824 | $676,500 | $151,200 | $525,300 |
| 2020 | $10,898 | $676,500 | $151,200 | $525,300 |
| 2019 | $10,817 | $676,500 | $151,200 | $525,300 |
| 2018 | $10,689 | $676,500 | $151,200 | $525,300 |
| 2017 | $10,770 | $676,500 | $151,200 | $525,300 |
| 2016 | $10,493 | $676,500 | $151,200 | $525,300 |
| 2015 | $10,127 | $676,500 | $151,200 | $525,300 |
| 2014 | $9,660 | $676,500 | $151,200 | $525,300 |
Source: Public Records
Map
Nearby Homes
- 720 Clinton St Unit 508
- 720 Clinton St Unit 603
- 719 Adams St Unit 2R
- 717 Adams St Unit 4R
- 123 Willow Terrace
- 610 Clinton St Unit 2E
- 264 7th St Unit 3
- 638 Park Ave
- 815 Willow Ave Unit 2R
- 703 Park Ave Unit 1
- 818 Jefferson St Unit 1C
- 528 Adams St Unit 2
- 523 Jefferson St Unit 3
- 911 Willow Ave Unit 1
- 209 6th St Unit 200
- 704 Bloomfield St Unit 2
- 422 Grand St Unit 5
- 422 Grand St Unit 3
- 919 Park Ave Unit 1R
- 906 Garden St
- 701 Grand St Unit 709
- 701 Grand St Unit 709
- 701 Grand St Unit 709
- 701 Grand St Unit 709
- 701 Grand St Unit 709
- 701 Grand St Unit 709
- 701 Grand St Unit 709
- 701 Grand St Unit 709
- 701 Grand St Unit 709
- 701 Grand St Unit 709
- 701 Grand St Unit 709
- 701 Grand St Unit 709
- 701 Grand St Unit 709
- 701 Grand St Unit 709
- 701 Grand St Unit 709
- 701 Grand St Unit 709
- 701 Grand St Unit 709
- 701 Grand St Unit 709
- 701 Grand St Unit 709
- 701 Grand St Unit 709