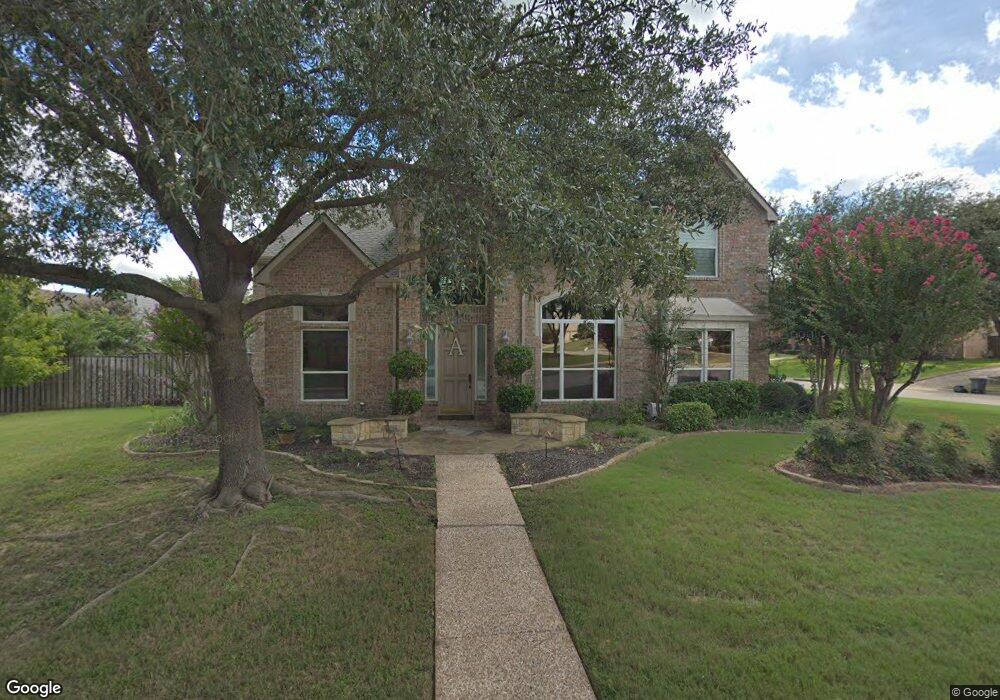
701 Inwood Dr Southlake, TX 76092
Estimated Value: $1,050,000 - $1,165,000
4
Beds
4
Baths
3,399
Sq Ft
$322/Sq Ft
Est. Value
About This Home
This home is located at 701 Inwood Dr, Southlake, TX 76092 and is currently estimated at $1,095,613, approximately $322 per square foot. 701 Inwood Dr is a home located in Tarrant County with nearby schools including Robert High Rockenbaugh Elementary School, Eubanks Intermediate School, and George Dawson Middle School.
Ownership History
Date
Name
Owned For
Owner Type
Purchase Details
Closed on
Oct 10, 2016
Sold by
Bruder Clifford S and Jones Bruder Ann Marie
Bought by
Arterburn Mike and Hankitiwat Jariyarujee
Current Estimated Value
Purchase Details
Closed on
Apr 28, 1999
Sold by
Giustra John M and Giustra Theresa A
Bought by
Bruder Clifford S and Bruder Ann Marie Jones
Home Financials for this Owner
Home Financials are based on the most recent Mortgage that was taken out on this home.
Original Mortgage
$240,000
Interest Rate
7.07%
Purchase Details
Closed on
Feb 27, 1996
Sold by
The Drees Company
Bought by
Glustra John M
Home Financials for this Owner
Home Financials are based on the most recent Mortgage that was taken out on this home.
Original Mortgage
$209,000
Interest Rate
7.01%
Create a Home Valuation Report for This Property
The Home Valuation Report is an in-depth analysis detailing your home's value as well as a comparison with similar homes in the area
Home Values in the Area
Average Home Value in this Area
Purchase History
| Date | Buyer | Sale Price | Title Company |
|---|---|---|---|
| Arterburn Mike | -- | None Available | |
| Bruder Clifford S | -- | -- | |
| Glustra John M | -- | Trinity Western Title Co |
Source: Public Records
Mortgage History
| Date | Status | Borrower | Loan Amount |
|---|---|---|---|
| Previous Owner | Bruder Clifford S | $282,800 | |
| Previous Owner | Bruder Clifford S | $240,000 | |
| Previous Owner | Glustra John M | $209,000 |
Source: Public Records
Tax History Compared to Growth
Tax History
| Year | Tax Paid | Tax Assessment Tax Assessment Total Assessment is a certain percentage of the fair market value that is determined by local assessors to be the total taxable value of land and additions on the property. | Land | Improvement |
|---|---|---|---|---|
| 2025 | $11,861 | $1,002,177 | $175,000 | $827,177 |
| 2024 | $11,861 | $1,002,177 | $175,000 | $827,177 |
| 2023 | $13,173 | $991,994 | $175,000 | $816,994 |
| 2022 | $14,175 | $832,849 | $150,000 | $682,849 |
| 2021 | $13,618 | $672,716 | $150,000 | $522,716 |
| 2020 | $12,481 | $543,000 | $150,000 | $393,000 |
| 2019 | $13,149 | $543,000 | $150,000 | $393,000 |
| 2018 | $12,318 | $543,000 | $105,000 | $438,000 |
| 2017 | $14,512 | $585,496 | $105,000 | $480,496 |
| 2016 | $13,132 | $529,813 | $105,000 | $424,813 |
| 2015 | $10,933 | $528,467 | $85,000 | $443,467 |
| 2014 | $10,933 | $453,500 | $55,000 | $398,500 |
Source: Public Records
Map
Nearby Homes
- 712 Ashleigh Ln
- 708 Nettleton Dr
- 710 Longford Dr
- 1100 La Paloma Ct
- 221 Pine Dr
- 1012 Cool River Dr
- 351 S White Chapel Blvd
- 807 Cross Ln
- 1227 Strathmore Dr
- 205 Edinburgh Ct
- 1032 Rosavine Dr
- 1028 Rosavine Dr
- 1017 Rosavine Dr
- 1004 Rosavine Dr
- 1020 Rosavine Dr
- 1012 Rosavine Dr
- 1024 Rosavine Dr
- 1005 Rosavine Dr
- 1016 Rosavine Dr
- 1008 Rosavine Dr
- 703 Inwood Dr
- 703 Heatherglen Dr
- 700 Heatherglen Dr
- 613 Heatherglen Dr
- 702 Heatherglen Dr
- 707 Inwood Dr
- 704 Heatherglen Dr
- 801 Heatherglen Ct
- 614 Heatherglen Dr
- 702 Inwood Dr
- 611 Heatherglen Dr
- 709 Inwood Dr
- 704 Inwood Dr
- 706 Heatherglen Dr
- 706 Inwood Dr
- 803 Heatherglen Ct
- 612 Heatherglen Dr
- 609 Heatherglen Dr
- 708 Inwood Dr
- 708 Heatherglen Dr