Estimated Value: $426,000 - $493,000
4
Beds
3
Baths
2,300
Sq Ft
$196/Sq Ft
Est. Value
About This Home
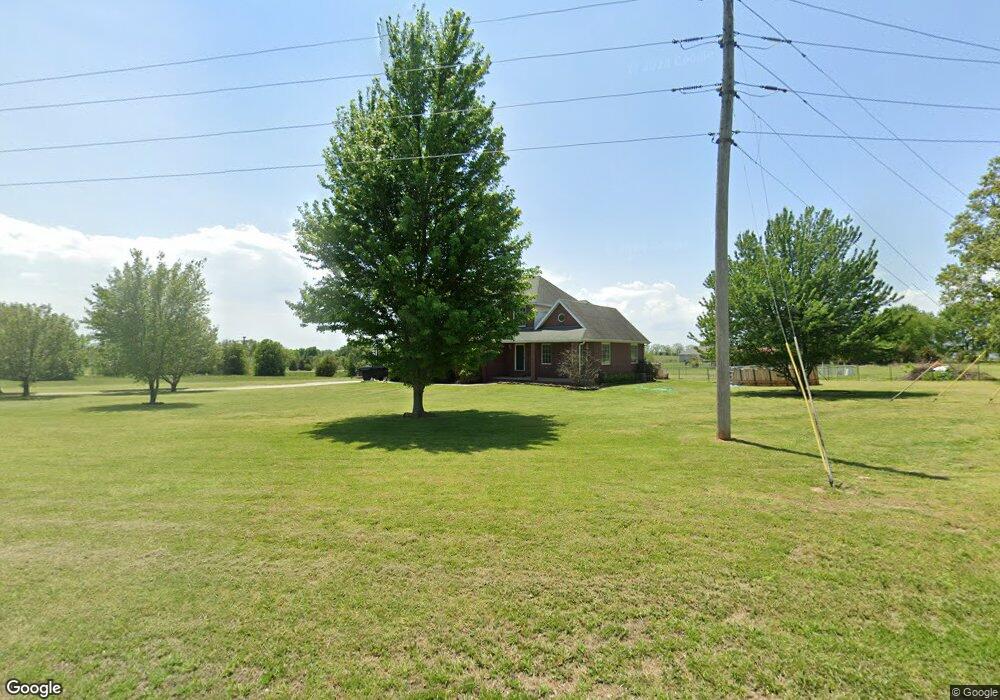
This home is located at 701 Larkspur Rd, Ozark, MO 65721 and is currently estimated at $450,095, approximately $195 per square foot. 701 Larkspur Rd is a home located in Christian County with nearby schools including East Elementary School, Ozark Junior High School, and Ozark Middle School.
Ownership History
Date
Name
Owned For
Owner Type
Purchase Details
Closed on
Dec 20, 2021
Sold by
Emmerth Jennifer L
Bought by
Emmerth Robert J
Current Estimated Value
Home Financials for this Owner
Home Financials are based on the most recent Mortgage that was taken out on this home.
Original Mortgage
$200,000
Outstanding Balance
$182,079
Interest Rate
2.98%
Mortgage Type
New Conventional
Estimated Equity
$268,016
Purchase Details
Closed on
Oct 18, 2010
Sold by
Fannie Mae
Bought by
Emmerth Robert J and Emmerth Jennifer L
Home Financials for this Owner
Home Financials are based on the most recent Mortgage that was taken out on this home.
Original Mortgage
$162,703
Interest Rate
4.37%
Mortgage Type
FHA
Purchase Details
Closed on
Aug 3, 2010
Sold by
Chase Home Finance Llc
Bought by
Federal National Mortgage Association
Purchase Details
Closed on
Jul 30, 2010
Sold by
Williams Jason R and Williams Marci A
Bought by
Chase Home Finance Llc
Create a Home Valuation Report for This Property
The Home Valuation Report is an in-depth analysis detailing your home's value as well as a comparison with similar homes in the area
Purchase History
| Date | Buyer | Sale Price | Title Company |
|---|---|---|---|
| Emmerth Robert J | $266,000 | None Listed On Document | |
| Emmerth Robert J | -- | None Available | |
| Federal National Mortgage Association | -- | None Available | |
| Chase Home Finance Llc | $167,410 | None Available |
Source: Public Records
Mortgage History
| Date | Status | Borrower | Loan Amount |
|---|---|---|---|
| Open | Emmerth Robert J | $200,000 | |
| Previous Owner | Emmerth Robert J | $162,703 |
Source: Public Records
Tax History
| Year | Tax Paid | Tax Assessment Tax Assessment Total Assessment is a certain percentage of the fair market value that is determined by local assessors to be the total taxable value of land and additions on the property. | Land | Improvement |
|---|---|---|---|---|
| 2025 | $2,596 | $48,300 | -- | -- |
| 2024 | $2,592 | $45,280 | -- | -- |
| 2023 | $2,592 | $45,280 | $0 | $0 |
| 2022 | $2,444 | $42,600 | $0 | $0 |
| 2021 | $2,448 | $42,600 | $0 | $0 |
| 2020 | $2,200 | $38,840 | $0 | $0 |
| 2019 | $2,200 | $38,840 | $0 | $0 |
| 2018 | $2,028 | $35,990 | $0 | $0 |
| 2017 | $2,028 | $35,990 | $0 | $0 |
| 2016 | $2,028 | $35,990 | $0 | $0 |
| 2015 | $2,028 | $35,990 | $35,990 | $0 |
| 2014 | $1,918 | $35,820 | $0 | $0 |
| 2013 | $1,899 | $35,470 | $0 | $0 |
| 2011 | -- | $70,940 | $0 | $0 |
Source: Public Records
Map
Nearby Homes
- 323 Larkspur Ct
- 598 Scenic View Rd
- 240 Iron Oaks
- 605 Moon Valley Rd
- 721 Lone Hickory Rd
- 1681 Prairie Ridge Rd
- 493 Red Cedar Rd
- 1035 Goldenrod Rd
- 1721 Jackson Spring Rd
- 000 Rr Center Rd
- 1234 Center Rd
- 2754 Prairie Ridge Rd
- 000 Center Rd
- 366 Stargrass Rd
- 1405 E Fairwind
- 2807 S 14th Ave
- 2601 S 15th Ave
- 2600 S 14th Ave
- 1433 E Warren Ave
- 000 E Warren Ave
- 493 Larkspur Rd
- 717 Larkspur Rd
- 3766 State Hwy W
- 3772 State Hwy W
- 225 Larkspur Ct
- 3560 State Hwy W
- 720 Larkspur Rd
- 510 Larkspur Rd
- 258 Larkspur Ct
- 393 Larkspur Rd
- 312 Larkspur Ct
- 198 Larkspur Ct
- 380 Larkspur Rd
- 322 Larkspur Ct
- 322 Larkspur Ct
- 820 Larkspur Rd
- 3577 State Hwy W
- 0000 State Hwy W
- 376 Larkspur Rd
- 4029 State Hwy W
Your Personal Tour Guide
Ask me questions while you tour the home.