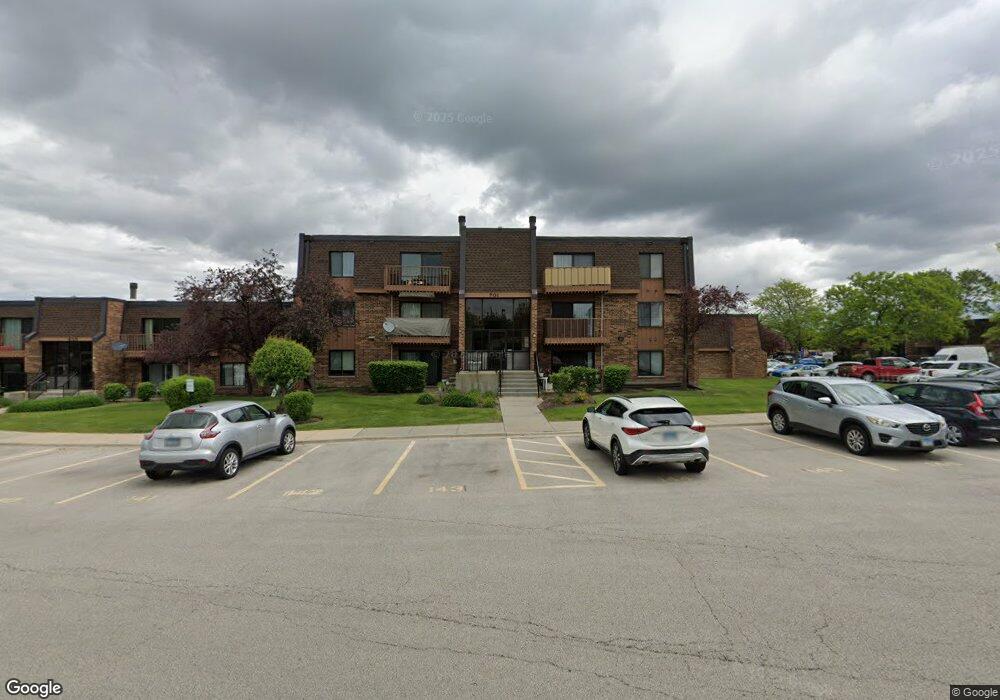
701 Limerick Ln Unit 7013A Schaumburg, IL 60193
South Schaumburg NeighborhoodEstimated Value: $163,000 - $210,000
1
Bed
1
Bath
825
Sq Ft
$224/Sq Ft
Est. Value
About This Home
This home is located at 701 Limerick Ln Unit 7013A, Schaumburg, IL 60193 and is currently estimated at $184,976, approximately $224 per square foot. 701 Limerick Ln Unit 7013A is a home located in Cook County with nearby schools including Edwin Aldrin Elementary School, Robert Frost Junior High School, and Schaumburg High School.
Ownership History
Date
Name
Owned For
Owner Type
Purchase Details
Closed on
Feb 28, 2020
Sold by
Radzik Krzysztof and City Of Schaumburg
Bought by
Mujagic Aldijana
Current Estimated Value
Home Financials for this Owner
Home Financials are based on the most recent Mortgage that was taken out on this home.
Original Mortgage
$122,735
Outstanding Balance
$110,187
Interest Rate
4.25%
Mortgage Type
FHA
Estimated Equity
$74,789
Purchase Details
Closed on
Dec 15, 2017
Sold by
Patel Mahjabeen
Bought by
Radzik Krzysztof
Home Financials for this Owner
Home Financials are based on the most recent Mortgage that was taken out on this home.
Original Mortgage
$87,300
Interest Rate
4.12%
Mortgage Type
New Conventional
Purchase Details
Closed on
Jun 28, 2005
Sold by
Devon Bank
Bought by
Patel Mahjabeen
Home Financials for this Owner
Home Financials are based on the most recent Mortgage that was taken out on this home.
Original Mortgage
$264,574
Interest Rate
5.69%
Mortgage Type
Seller Take Back
Create a Home Valuation Report for This Property
The Home Valuation Report is an in-depth analysis detailing your home's value as well as a comparison with similar homes in the area
Home Values in the Area
Average Home Value in this Area
Purchase History
| Date | Buyer | Sale Price | Title Company |
|---|---|---|---|
| Mujagic Aldijana | $125,000 | Proper Title Llc | |
| Radzik Krzysztof | $90,000 | Chicago Title | |
| Patel Mahjabeen | -- | Pntn | |
| Devon Bank | $115,000 | Pntn |
Source: Public Records
Mortgage History
| Date | Status | Borrower | Loan Amount |
|---|---|---|---|
| Open | Mujagic Aldijana | $122,735 | |
| Previous Owner | Radzik Krzysztof | $87,300 | |
| Previous Owner | Patel Mahjabeen | $264,574 |
Source: Public Records
Tax History Compared to Growth
Tax History
| Year | Tax Paid | Tax Assessment Tax Assessment Total Assessment is a certain percentage of the fair market value that is determined by local assessors to be the total taxable value of land and additions on the property. | Land | Improvement |
|---|---|---|---|---|
| 2024 | $3,199 | $11,421 | $1,776 | $9,645 |
| 2023 | $3,102 | $11,421 | $1,776 | $9,645 |
| 2022 | $3,102 | $11,421 | $1,776 | $9,645 |
| 2021 | $2,845 | $9,388 | $1,204 | $8,184 |
| 2020 | $1,872 | $9,388 | $1,204 | $8,184 |
| 2019 | $1,897 | $10,506 | $1,204 | $9,302 |
| 2018 | $993 | $6,745 | $1,078 | $5,667 |
| 2017 | $1,992 | $6,745 | $1,078 | $5,667 |
| 2016 | $1,863 | $6,745 | $1,078 | $5,667 |
| 2015 | $1,933 | $6,462 | $951 | $5,511 |
| 2014 | $1,912 | $6,462 | $951 | $5,511 |
| 2013 | $1,863 | $6,462 | $951 | $5,511 |
Source: Public Records
Map
Nearby Homes
- 635 Limerick Ln Unit 2B
- 631 Derry Ct Unit 3C
- 620 Tralee Ct Unit 3A
- 620 Tralee Ct Unit 3B
- 727 Killarney Ct Unit 1C
- 614 Tralee Ct Unit 2-C
- 711 Tipperary Ct Unit 2D
- 712 Tipperary Ct Unit 1C
- 722 Tipperary Ct Unit 3D
- 733 Limerick Ln Unit 7333D
- 553 Stone Gate Cir
- 712 Dante Ct
- 36 Shore Dr
- 300 S Roselle Rd Unit 419
- 300 S Roselle Rd Unit 519
- 300 S Roselle Rd Unit 116
- 300 S Roselle Rd Unit 207
- 415 Laconia Ln
- 226 Timbercrest Dr
- 126 Manchester Ct Unit 61B
- 701 Limerick Ln Unit 7011C
- 701 Limerick Ln Unit 7012D
- 701 Limerick Ln Unit 7011D
- 701 Limerick Ln Unit 7011B
- 122 Mullingar Ct Unit 1221C
- 701 Limerick Ln Unit 7012B
- 701 Limerick Ln Unit 7013D
- 122 Mullingar Ct Unit 1221A
- 122 Mullingar Ct Unit 1221B
- 701 Limerick Ln Unit 7013C
- 122 Mullingar Ct Unit 1222A
- 122 Mullingar Ct Unit 1222D
- 122 Mullingar Ct Unit 1221D
- 701 Limerick Ln Unit 7013B
- 122 Mullingar Ct Unit 1222B
- 701 Limerick Ln Unit 7012C
- 701 Limerick Ln Unit 7012A
- 701 Limerick Ln Unit 7011A
- 122 Mullingar Ct Unit 1222C
- 701 Limerick Ln Unit 3-A