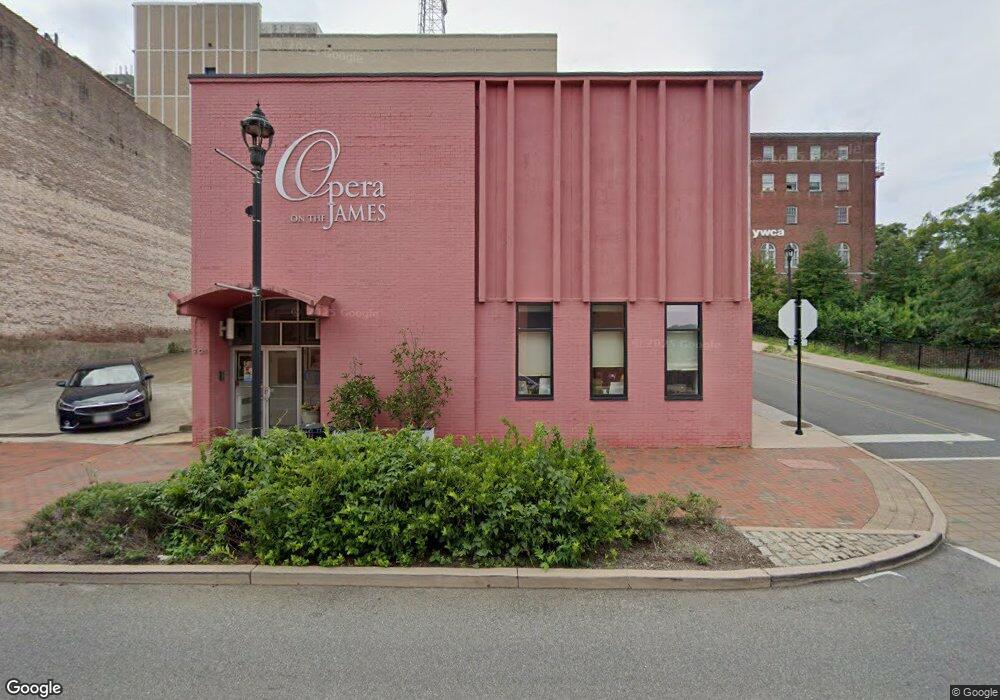
701 Main St Lynchburg, VA 24504
Central Business District NeighborhoodEstimated Value: $414,969
--
Bed
--
Bath
14,640
Sq Ft
$28/Sq Ft
Est. Value
About This Home
This home is located at 701 Main St, Lynchburg, VA 24504 and is currently estimated at $414,969, approximately $28 per square foot. 701 Main St is a home located in Lynchburg City with nearby schools including Paul Munro Elementary School, Linkhorne Middle School, and E.C. Glass High School.
Ownership History
Date
Name
Owned For
Owner Type
Purchase Details
Closed on
Sep 16, 2010
Sold by
W A K Llc
Bought by
Opera On The James Inc
Current Estimated Value
Purchase Details
Closed on
Jun 6, 2007
Sold by
Genworth Life And Annuity Insurance Com
Bought by
W A K Llc
Home Financials for this Owner
Home Financials are based on the most recent Mortgage that was taken out on this home.
Original Mortgage
$200,000
Interest Rate
6.14%
Mortgage Type
Credit Line Revolving
Create a Home Valuation Report for This Property
The Home Valuation Report is an in-depth analysis detailing your home's value as well as a comparison with similar homes in the area
Home Values in the Area
Average Home Value in this Area
Purchase History
| Date | Buyer | Sale Price | Title Company |
|---|---|---|---|
| Opera On The James Inc | $206,000 | None Available | |
| W A K Llc | -- | None Available |
Source: Public Records
Mortgage History
| Date | Status | Borrower | Loan Amount |
|---|---|---|---|
| Previous Owner | W A K Llc | $200,000 |
Source: Public Records
Tax History Compared to Growth
Tax History
| Year | Tax Paid | Tax Assessment Tax Assessment Total Assessment is a certain percentage of the fair market value that is determined by local assessors to be the total taxable value of land and additions on the property. | Land | Improvement |
|---|---|---|---|---|
| 2025 | $4,410 | $525,000 | $182,200 | $342,800 |
| 2024 | $4,450 | $500,000 | $182,200 | $317,800 |
| 2023 | $4,450 | $500,000 | $182,200 | $317,800 |
| 2022 | $4,918 | $477,500 | $182,200 | $295,300 |
| 2021 | $5,300 | $477,500 | $182,200 | $295,300 |
| 2020 | $4,982 | $448,800 | $182,200 | $266,600 |
| 2019 | $4,982 | $448,800 | $182,200 | $266,600 |
| 2018 | $5,154 | $464,300 | $126,800 | $337,500 |
| 2017 | $5,154 | $464,300 | $126,800 | $337,500 |
| 2016 | $5,154 | $464,300 | $126,800 | $337,500 |
| 2015 | $5,154 | $464,300 | $126,800 | $337,500 |
| 2014 | $5,154 | $464,300 | $126,800 | $337,500 |
Source: Public Records
Map
Nearby Homes