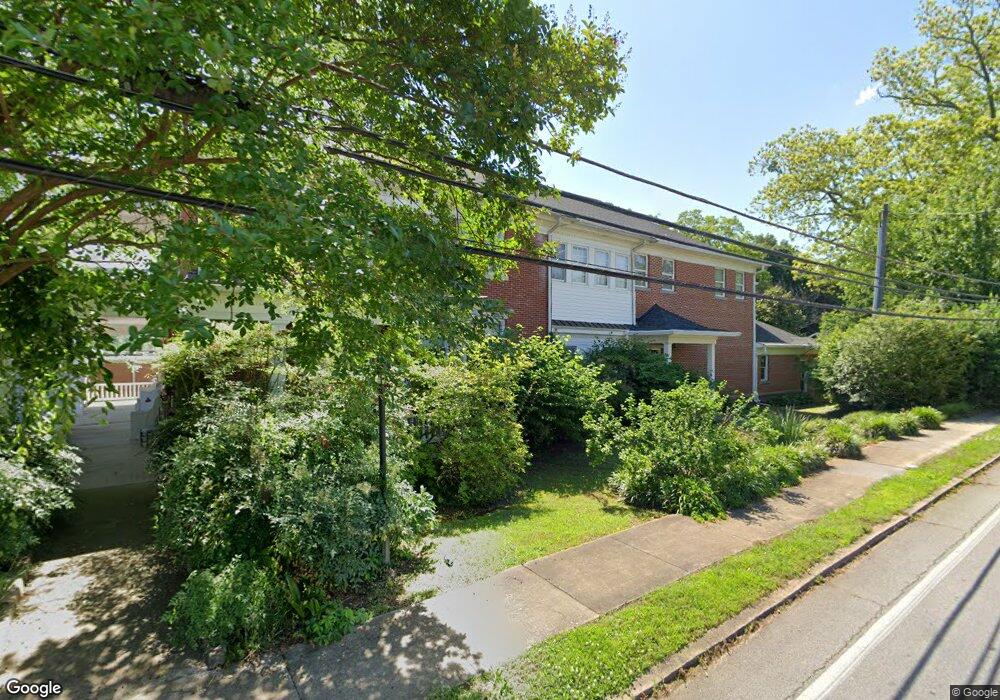
701 Maple St Carrollton, GA 30117
Estimated Value: $263,629 - $302,000
3
Beds
2
Baths
1,860
Sq Ft
$152/Sq Ft
Est. Value
About This Home
This home is located at 701 Maple St, Carrollton, GA 30117 and is currently estimated at $282,407, approximately $151 per square foot. 701 Maple St is a home located in Carroll County with nearby schools including Carrollton Elementary School, Carrollton Upper Elementary School, and Carrollton Middle School.
Ownership History
Date
Name
Owned For
Owner Type
Purchase Details
Closed on
Nov 20, 2020
Sold by
101 Orchard Street Llc
Bought by
Self Brian Scott and Self Alisha Nicole
Current Estimated Value
Home Financials for this Owner
Home Financials are based on the most recent Mortgage that was taken out on this home.
Original Mortgage
$185,250
Outstanding Balance
$163,805
Interest Rate
2.8%
Mortgage Type
New Conventional
Estimated Equity
$118,602
Purchase Details
Closed on
Oct 2, 2012
Sold by
Wellborn R Gary
Bought by
101 Orchard Street Llc
Purchase Details
Closed on
Nov 25, 1998
Sold by
Wellborn Myrna J
Bought by
Wellborn Wellborn R and Wellborn My
Purchase Details
Closed on
Oct 17, 1997
Sold by
Autry John
Bought by
Wellborn Myrna J
Purchase Details
Closed on
Jan 26, 1990
Bought by
Autry
Create a Home Valuation Report for This Property
The Home Valuation Report is an in-depth analysis detailing your home's value as well as a comparison with similar homes in the area
Home Values in the Area
Average Home Value in this Area
Purchase History
| Date | Buyer | Sale Price | Title Company |
|---|---|---|---|
| Self Brian Scott | $195,000 | -- | |
| 101 Orchard Street Llc | -- | -- | |
| Wellborn Wellborn R | -- | -- | |
| Wellborn Myrna J | $72,900 | -- | |
| Autry | $68,900 | -- |
Source: Public Records
Mortgage History
| Date | Status | Borrower | Loan Amount |
|---|---|---|---|
| Open | Self Brian Scott | $185,250 |
Source: Public Records
Tax History Compared to Growth
Tax History
| Year | Tax Paid | Tax Assessment Tax Assessment Total Assessment is a certain percentage of the fair market value that is determined by local assessors to be the total taxable value of land and additions on the property. | Land | Improvement |
|---|---|---|---|---|
| 2024 | $2,398 | $87,776 | $6,000 | $81,776 |
| 2023 | $2,398 | $80,380 | $6,000 | $74,380 |
| 2022 | $1,917 | $65,684 | $6,000 | $59,684 |
| 2021 | $1,669 | $57,184 | $6,000 | $51,184 |
| 2020 | $1,511 | $51,704 | $6,000 | $45,704 |
| 2019 | $1,413 | $47,900 | $6,000 | $41,900 |
| 2018 | $1,467 | $49,017 | $6,000 | $43,017 |
| 2017 | $1,261 | $41,898 | $6,000 | $35,898 |
| 2016 | $1,268 | $41,898 | $6,000 | $35,898 |
| 2015 | $1,125 | $36,410 | $4,000 | $32,410 |
| 2014 | $1,129 | $36,410 | $4,000 | $32,410 |
Source: Public Records
Map
Nearby Homes
- 160 Watson St
- 219 Broad St
- 516 Longview St
- 109 S Park St
- 27 South St
- 301 Bradley St
- 301 C4 Bradley St
- TRACT1-7 Us Highway 27
- 205 Johnson Ave Unit 231
- 108 Springwood Dr
- 405 N Park St
- 0 Ward St Unit 10390499
- 0 Hwy 27 None N
- 110 Town Walk Ln
- 105 Haygood Place
- 654 King St
- 141 Bowen St
- 109 7th St
- 142 Griffin Dr
- 105 Mara St