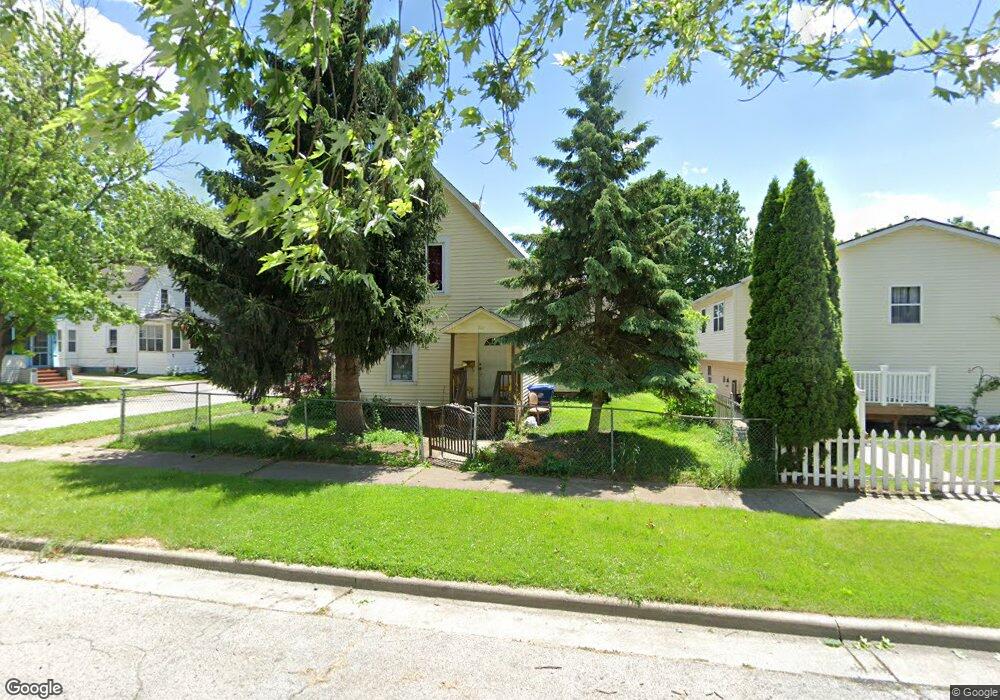
701 Myrtle St Waukegan, IL 60085
Estimated Value: $178,000 - $254,000
3
Beds
2
Baths
1,500
Sq Ft
$150/Sq Ft
Est. Value
About This Home
This home is located at 701 Myrtle St, Waukegan, IL 60085 and is currently estimated at $224,490, approximately $149 per square foot. 701 Myrtle St is a home located in Lake County with nearby schools including Glen Flora Elementary School, Edith M Smith Middle School, and Waukegan High School.
Ownership History
Date
Name
Owned For
Owner Type
Purchase Details
Closed on
Apr 12, 2011
Sold by
Gutierrez Mario
Bought by
Gutierrez Mario and Gutierrez Jesus
Current Estimated Value
Purchase Details
Closed on
Aug 18, 2010
Sold by
Fannie Mae
Bought by
Gutierrez Mario
Purchase Details
Closed on
Jun 11, 2010
Sold by
Flores Gonzalo
Bought by
Federal National Mortgage Association
Purchase Details
Closed on
Apr 19, 2002
Sold by
Gaytan Delfino and Najera Margarita
Bought by
Flores Gonzalo
Home Financials for this Owner
Home Financials are based on the most recent Mortgage that was taken out on this home.
Original Mortgage
$106,331
Interest Rate
6.93%
Mortgage Type
FHA
Create a Home Valuation Report for This Property
The Home Valuation Report is an in-depth analysis detailing your home's value as well as a comparison with similar homes in the area
Home Values in the Area
Average Home Value in this Area
Purchase History
| Date | Buyer | Sale Price | Title Company |
|---|---|---|---|
| Gutierrez Mario | -- | None Available | |
| Gutierrez Mario | $28,500 | First American Title | |
| Federal National Mortgage Association | -- | None Available | |
| Flores Gonzalo | $108,000 | First American Title |
Source: Public Records
Mortgage History
| Date | Status | Borrower | Loan Amount |
|---|---|---|---|
| Previous Owner | Flores Gonzalo | $106,331 |
Source: Public Records
Tax History Compared to Growth
Tax History
| Year | Tax Paid | Tax Assessment Tax Assessment Total Assessment is a certain percentage of the fair market value that is determined by local assessors to be the total taxable value of land and additions on the property. | Land | Improvement |
|---|---|---|---|---|
| 2024 | $4,643 | $63,532 | $8,281 | $55,251 |
| 2023 | $4,643 | $57,243 | $7,414 | $49,829 |
| 2022 | $4,470 | $51,721 | $7,052 | $44,669 |
| 2021 | $4,025 | $44,610 | $6,289 | $38,321 |
| 2020 | $4,031 | $41,560 | $5,859 | $35,701 |
| 2019 | $4,004 | $38,083 | $5,369 | $32,714 |
| 2018 | $3,236 | $34,339 | $6,839 | $27,500 |
| 2017 | $2,731 | $30,381 | $6,051 | $24,330 |
| 2016 | $2,438 | $26,400 | $5,258 | $21,142 |
| 2015 | $2,278 | $23,628 | $4,706 | $18,922 |
| 2014 | $2,394 | $23,877 | $4,703 | $19,174 |
| 2012 | $3,187 | $21,329 | $5,097 | $16,232 |
Source: Public Records
Map
Nearby Homes
- 620 N Poplar St
- 702 Franklin St
- 918 N Ash St
- 522 N Poplar St
- 511 Chestnut St
- 428 N Poplar St
- 917 N Linden Ave
- 1109 Massena Ave
- 1110 N Ash St
- 452 North Ave
- 325 4th St
- 415 W Ridgeland Ave
- 1122 N Ash St
- 1000 Pine St
- 824 N Butrick St
- 723 N County St
- 1105 Woodlawn Cir
- 509 N Butrick St
- 611 N Genesee St
- 1335 Chestnut St
- 707 Myrtle St
- 709 Myrtle St
- 815 N Poplar St
- 813 N Poplar St
- 819 N Poplar St
- 711 Myrtle St
- 700 Center St
- 708 Center St
- 650 Center St
- 713 Myrtle St
- 710 Center St Unit 2F
- 710 Center St Unit 2R
- 710 Center St
- 710 Center St Unit 1R
- 710 Center St Unit 1F
- 700 Myrtle St
- 643 Myrtle St
- 706 Myrtle St
- 714 Center St
- 648 Center St