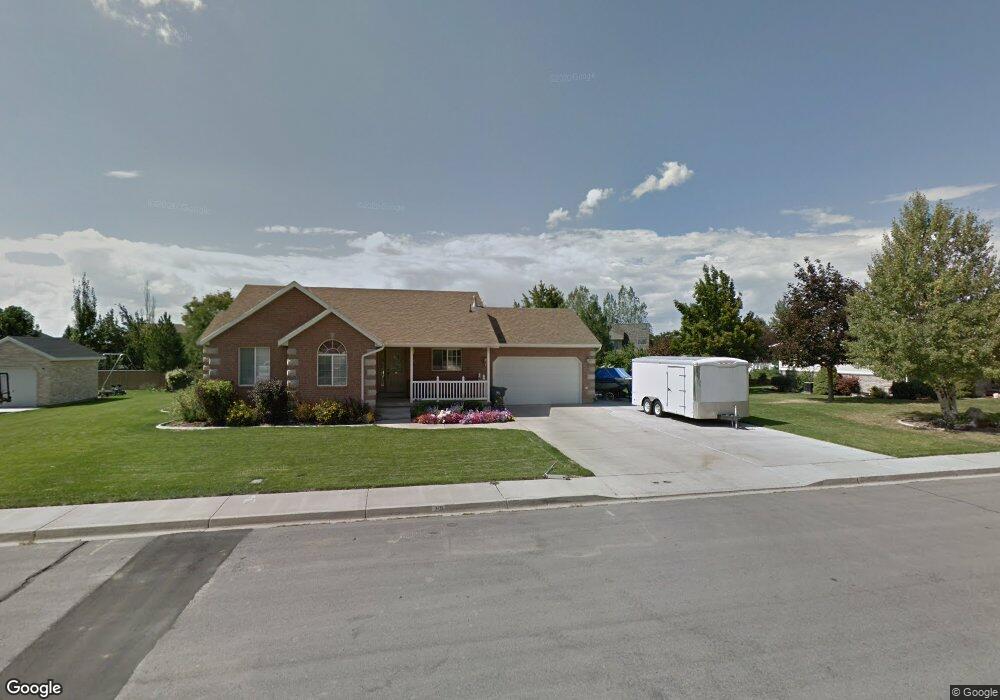
701 N 1000 E Mapleton, UT 84664
Estimated Value: $789,000 - $893,000
4
Beds
4
Baths
2,543
Sq Ft
$332/Sq Ft
Est. Value
About This Home
This home is located at 701 N 1000 E, Mapleton, UT 84664 and is currently estimated at $844,466, approximately $332 per square foot. 701 N 1000 E is a home located in Utah County with nearby schools including Hobble Creek School, Mapleton Junior High School, and Maple Mountain High School.
Ownership History
Date
Name
Owned For
Owner Type
Purchase Details
Closed on
Jan 7, 2021
Sold by
Aragon Yolanda Elizabeth
Bought by
Christensen David and Christensen Deena
Current Estimated Value
Home Financials for this Owner
Home Financials are based on the most recent Mortgage that was taken out on this home.
Original Mortgage
$150,000
Outstanding Balance
$133,852
Interest Rate
2.7%
Mortgage Type
Credit Line Revolving
Estimated Equity
$710,614
Purchase Details
Closed on
Oct 8, 1998
Sold by
Walker Joe A
Bought by
Christensen Cory L and Christensen Cynthia A
Home Financials for this Owner
Home Financials are based on the most recent Mortgage that was taken out on this home.
Original Mortgage
$150,000
Interest Rate
6.71%
Create a Home Valuation Report for This Property
The Home Valuation Report is an in-depth analysis detailing your home's value as well as a comparison with similar homes in the area
Home Values in the Area
Average Home Value in this Area
Purchase History
| Date | Buyer | Sale Price | Title Company |
|---|---|---|---|
| Christensen David | -- | Greenbrier Title | |
| Christensen Cory L | -- | -- |
Source: Public Records
Mortgage History
| Date | Status | Borrower | Loan Amount |
|---|---|---|---|
| Open | Christensen David | $150,000 | |
| Previous Owner | Christensen Cory L | $150,000 | |
| Closed | Christensen Cory L | $9,800 |
Source: Public Records
Tax History
| Year | Tax Paid | Tax Assessment Tax Assessment Total Assessment is a certain percentage of the fair market value that is determined by local assessors to be the total taxable value of land and additions on the property. | Land | Improvement |
|---|---|---|---|---|
| 2025 | $3,865 | $423,390 | -- | -- |
| 2024 | $3,865 | $378,620 | $0 | $0 |
| 2023 | $3,890 | $383,515 | $0 | $0 |
| 2022 | $3,389 | $330,385 | $0 | $0 |
| 2021 | $2,840 | $425,000 | $160,900 | $264,100 |
| 2020 | $2,808 | $406,500 | $142,400 | $264,100 |
| 2019 | $2,526 | $373,200 | $136,600 | $236,600 |
| 2018 | $2,340 | $329,100 | $115,000 | $214,100 |
| 2017 | $2,182 | $162,855 | $0 | $0 |
| 2016 | $2,141 | $158,895 | $0 | $0 |
| 2015 | $2,074 | $152,955 | $0 | $0 |
| 2014 | $1,929 | $139,700 | $0 | $0 |
Source: Public Records
Map
Nearby Homes
- 775 N 800 E
- 1096 N 1000 E
- 594 E 1000 N
- 310 N 800 E
- 435 E 1000 N
- 162 N 800 E
- 1548 N 1350 St E Unit 11
- 1578 N 1350 St E Unit 12
- 1447 N 1350 St E Unit 5
- 1577 N 1350 St E Unit 1
- 1477 N 1350 St E Unit 4
- 1547 N 1350 St E Unit 2
- 1511 N 1350 St E Unit 3
- 265 E 600 N
- 141 N 600 E
- 745 E Maple St
- 1377 E Maple St
- 630 N 1600 E
- 1567 N 600 E Unit 26
- 1515 E Maple St
Your Personal Tour Guide
Ask me questions while you tour the home.