Estimated Value: $155,000 - $187,000
3
Beds
2
Baths
1,665
Sq Ft
$104/Sq Ft
Est. Value
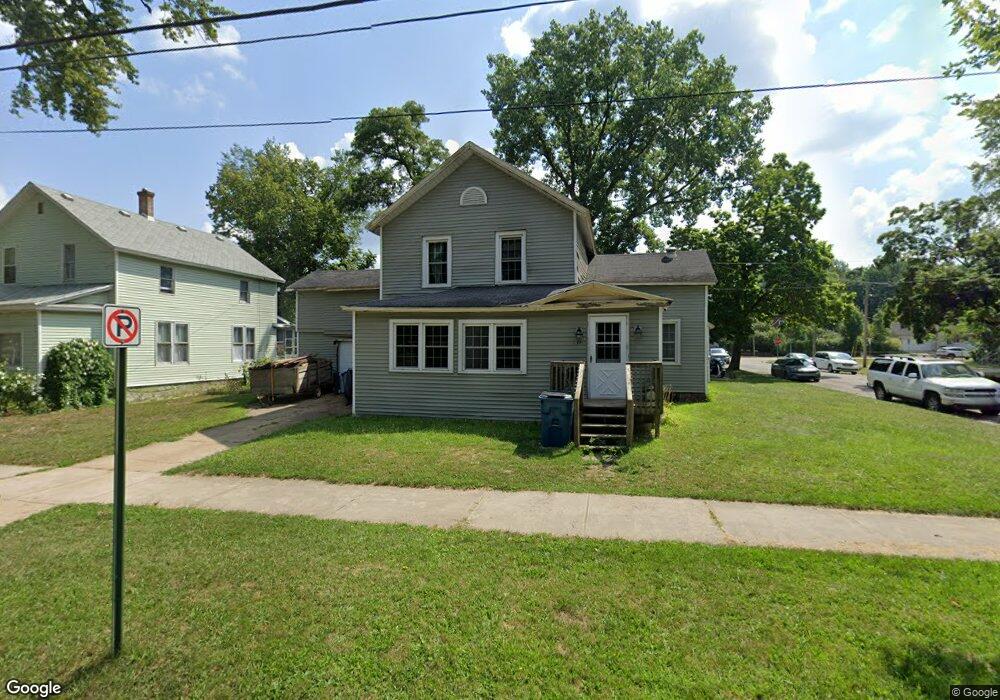
About This Home
This home is located at 701 N 4th St, Niles, MI 49120 and is currently estimated at $172,716, approximately $103 per square foot. 701 N 4th St is a home located in Berrien County with nearby schools including Ballard Elementary School, Oak Manor Sixth Grade Center, and Ring Lardner Middle School.
Ownership History
Date
Name
Owned For
Owner Type
Purchase Details
Closed on
Jun 17, 2024
Sold by
Jones Luke K
Bought by
Berrien County Treasurer
Current Estimated Value
Purchase Details
Closed on
Apr 25, 2017
Sold by
Sweet Theodore
Bought by
Jones Luke K
Purchase Details
Closed on
Feb 9, 2015
Sold by
Singh Aubri Anna
Bought by
Sweet Theodore
Purchase Details
Closed on
Jan 13, 2015
Sold by
Jones Frank
Bought by
Singh Aubri Anna
Purchase Details
Closed on
Oct 14, 2014
Sold by
Jones Luke King
Bought by
Jones Frank Scot
Purchase Details
Closed on
Jan 22, 2009
Sold by
Tabbert Tammy S and Tabbert Terry L
Bought by
Indymac Federal Bank Fsb
Purchase Details
Closed on
Aug 31, 2004
Sold by
Egmer Thomas E and Egmer Carol Ann
Bought by
Morgan Pamela J
Purchase Details
Closed on
Mar 20, 1987
Create a Home Valuation Report for This Property
The Home Valuation Report is an in-depth analysis detailing your home's value as well as a comparison with similar homes in the area
Home Values in the Area
Average Home Value in this Area
Purchase History
| Date | Buyer | Sale Price | Title Company |
|---|---|---|---|
| Berrien County Treasurer | -- | -- | |
| Jones Luke K | -- | None Available | |
| Sweet Theodore | -- | None Available | |
| Singh Aubri Anna | -- | None Available | |
| Jones Frank Scot | -- | None Available | |
| Indymac Federal Bank Fsb | $38,413 | None Available | |
| Morgan Pamela J | $15,500 | -- | |
| -- | $15,500 | -- |
Source: Public Records
Tax History Compared to Growth
Tax History
| Year | Tax Paid | Tax Assessment Tax Assessment Total Assessment is a certain percentage of the fair market value that is determined by local assessors to be the total taxable value of land and additions on the property. | Land | Improvement |
|---|---|---|---|---|
| 2025 | $978 | $68,000 | $0 | $0 |
| 2024 | $757 | $67,100 | $0 | $0 |
| 2023 | $726 | $48,300 | $0 | $0 |
| 2022 | $691 | $28,500 | $0 | $0 |
| 2021 | $1,261 | $26,000 | $2,600 | $23,400 |
| 2020 | $1,246 | $24,600 | $0 | $0 |
| 2019 | $1,228 | $21,100 | $1,800 | $19,300 |
| 2018 | $1,230 | $21,100 | $0 | $0 |
| 2017 | $1,273 | $24,500 | $0 | $0 |
| 2016 | $1,251 | $22,300 | $0 | $0 |
| 2015 | $1,075 | $28,500 | $0 | $0 |
| 2014 | $758 | $25,400 | $0 | $0 |
Source: Public Records
Map
Nearby Homes