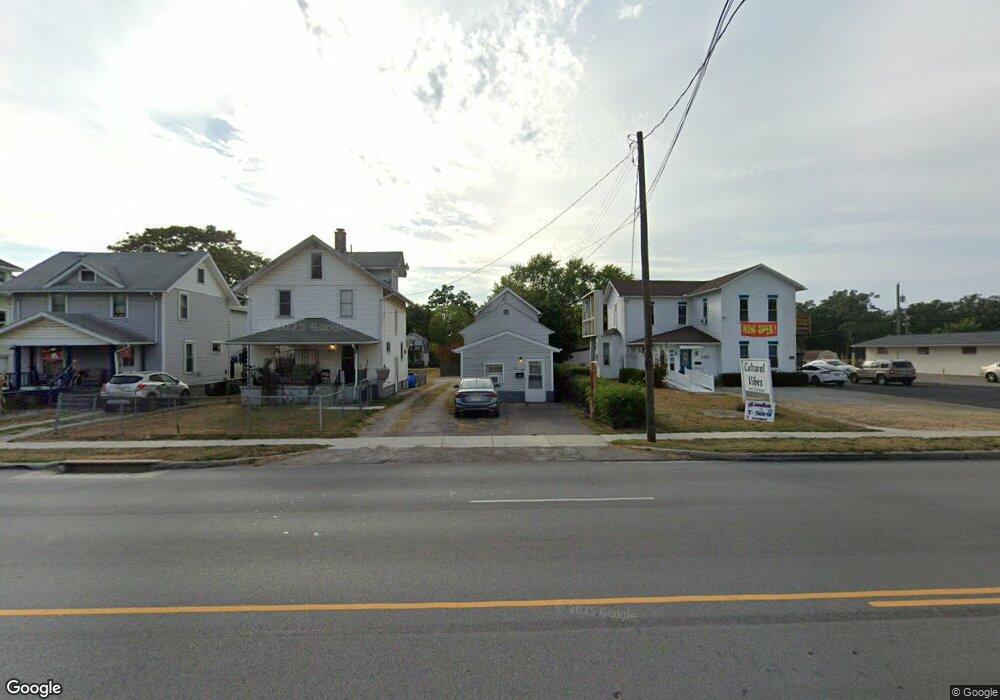
701 N Main St Marion, OH 43302
Estimated Value: $76,000 - $115,000
3
Beds
1
Bath
1,570
Sq Ft
$61/Sq Ft
Est. Value
About This Home
This home is located at 701 N Main St, Marion, OH 43302 and is currently estimated at $95,663, approximately $60 per square foot. 701 N Main St is a home located in Marion County with nearby schools including William H. Taft Elementary School, Ulysses S. Grant Middle School, and Harding High School.
Ownership History
Date
Name
Owned For
Owner Type
Purchase Details
Closed on
Apr 19, 2017
Sold by
Scheff Belinda K and Gattshall Brenda F
Bought by
Scheff Belinda K and Gattshall Brenda F
Current Estimated Value
Purchase Details
Closed on
May 20, 2015
Sold by
Ackerman Valerie and Ackerman Douglas
Bought by
Scheff Belinda
Purchase Details
Closed on
Jan 9, 2014
Sold by
Mcdole Kenneth J
Bought by
Ackerman Valerie R
Purchase Details
Closed on
Jan 19, 2012
Sold by
Lucas Randall and Lucas Jodi L
Bought by
Mcdole Kenneth J
Purchase Details
Closed on
Jan 5, 2011
Sold by
The Ohio State Bank
Bought by
Lucas Randall
Purchase Details
Closed on
Jun 25, 2010
Sold by
Devore Rentals Llc
Bought by
The Ohio State Bank
Purchase Details
Closed on
Oct 26, 2005
Sold by
Devore John A C and Devore Susan M
Bought by
Devore Rentals Llc
Purchase Details
Closed on
Jun 25, 2003
Bought by
Scheff Belinda
Purchase Details
Closed on
Mar 29, 2000
Bought by
Scheff Belinda
Purchase Details
Closed on
Apr 24, 1998
Bought by
Scheff Belinda
Create a Home Valuation Report for This Property
The Home Valuation Report is an in-depth analysis detailing your home's value as well as a comparison with similar homes in the area
Home Values in the Area
Average Home Value in this Area
Purchase History
| Date | Buyer | Sale Price | Title Company |
|---|---|---|---|
| Scheff Belinda K | -- | Attorney | |
| Scheff Belinda | $17,000 | Ct | |
| Ackerman Valerie R | $14,000 | None Available | |
| Mcdole Kenneth J | $42,000 | Marion Title | |
| Lucas Randall | $10,000 | Chicago Title | |
| The Ohio State Bank | -- | None Available | |
| Devore Rentals Llc | -- | None Available | |
| Scheff Belinda | $45,000 | -- | |
| Scheff Belinda | -- | -- | |
| Scheff Belinda | $15,800 | -- |
Source: Public Records
Tax History Compared to Growth
Tax History
| Year | Tax Paid | Tax Assessment Tax Assessment Total Assessment is a certain percentage of the fair market value that is determined by local assessors to be the total taxable value of land and additions on the property. | Land | Improvement |
|---|---|---|---|---|
| 2024 | $707 | $18,400 | $1,900 | $16,500 |
| 2023 | $707 | $18,400 | $1,900 | $16,500 |
| 2022 | $656 | $18,400 | $1,900 | $16,500 |
| 2021 | $615 | $15,530 | $1,660 | $13,870 |
| 2020 | $729 | $15,530 | $1,660 | $13,870 |
| 2019 | $660 | $15,530 | $1,660 | $13,870 |
| 2018 | $556 | $13,600 | $1,660 | $11,940 |
| 2017 | $625 | $13,600 | $1,660 | $11,940 |
| 2016 | $543 | $13,600 | $1,660 | $11,940 |
| 2015 | $542 | $13,290 | $1,580 | $11,710 |
| 2014 | $544 | $13,290 | $1,580 | $11,710 |
| 2012 | $576 | $13,990 | $710 | $13,280 |
Source: Public Records
Map
Nearby Homes
- 736 N Main St
- 197 Harrison St
- 593 N State St
- 197 Wallace St
- 552 N Prospect St
- 524 N State St
- 149 Fairview St
- 551 Universal Ave Unit 555
- 291 Patten St
- 434 N State St
- 455 Park St
- 1015 N Main St
- 395 N Main St
- 375 N Main St
- 749 Richmond Ave
- 592 N Greenwood St
- 347 Mary St
- 236 Silver St
- 343 Commercial St
- 266 Oak St
- 697 N Main St
- 707 N Main St
- 691 N Main St
- 687 N Main St
- 0 Ohio 423
- 719 N Main St
- 669 N Main St
- 701 Roslyn Ct
- 128 W Fairground St
- 698 N Main St
- 686 N Main St
- 716 N Main St
- 142 W Fairground St
- 725 N Main St
- 668 N Main St
- 146 W Fairground St
- 741 N Main St
- 680 N Main St
- 152 W Fairground St
- 678 N Main St