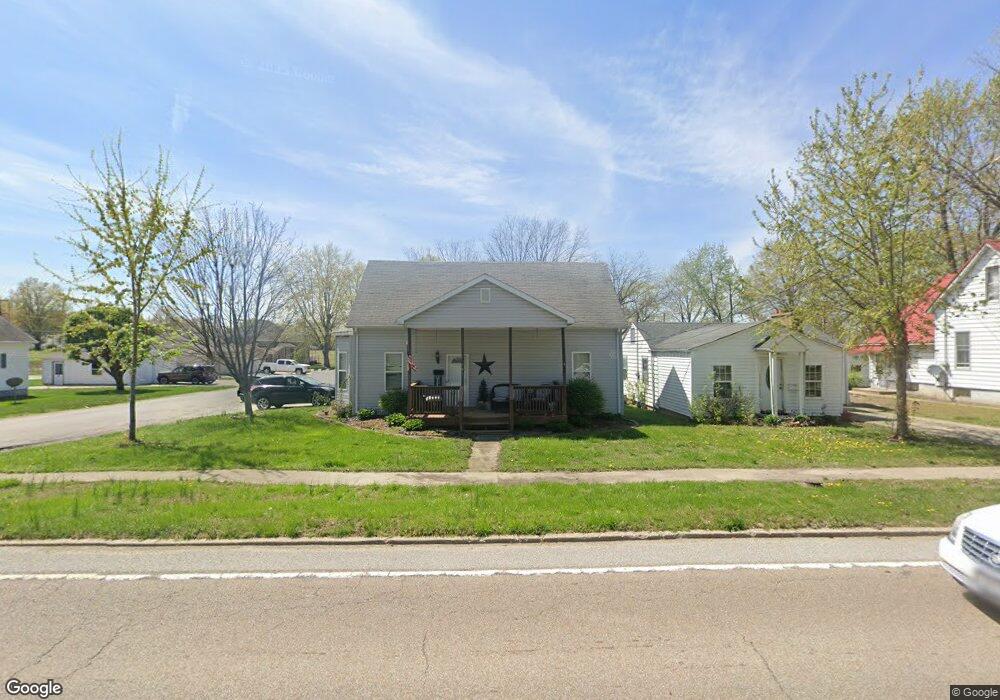
701 N Main St Marissa, IL 62257
Estimated Value: $77,000 - $84,000
Studio
--
Bath
901
Sq Ft
$89/Sq Ft
Est. Value
About This Home
This home is located at 701 N Main St, Marissa, IL 62257 and is currently estimated at $80,089, approximately $88 per square foot. 701 N Main St is a home located in St. Clair County with nearby schools including Marissa Elementary School and Marissa Jr & Sr High School.
Ownership History
Date
Name
Owned For
Owner Type
Purchase Details
Closed on
May 3, 2016
Sold by
Thornton Gary
Bought by
Krause George A
Current Estimated Value
Home Financials for this Owner
Home Financials are based on the most recent Mortgage that was taken out on this home.
Original Mortgage
$51,300
Outstanding Balance
$33,534
Interest Rate
5%
Mortgage Type
Future Advance Clause Open End Mortgage
Estimated Equity
$46,555
Purchase Details
Closed on
Apr 5, 2013
Sold by
Cairns Daisy and Thornton Gary
Bought by
Thornton Gary
Purchase Details
Closed on
Aug 30, 2010
Sold by
Wells Fargo Bank Na
Bought by
Thornton Gary A and Cairns Daisy
Home Financials for this Owner
Home Financials are based on the most recent Mortgage that was taken out on this home.
Original Mortgage
$25,000
Interest Rate
4.42%
Mortgage Type
Credit Line Revolving
Purchase Details
Closed on
Mar 12, 2010
Sold by
Forrester Jeffrey Scott
Bought by
Wells Fargo Bank Na
Purchase Details
Closed on
Jun 2, 2004
Sold by
Fults Kenneth
Bought by
Forrester Jeffrey Scott and Forrester Erica Marie
Create a Home Valuation Report for This Property
The Home Valuation Report is an in-depth analysis detailing your home's value as well as a comparison with similar homes in the area
Purchase History
| Date | Buyer | Sale Price | Title Company |
|---|---|---|---|
| Krause George A | $51,000 | Attorney | |
| Thornton Gary | -- | None Available | |
| Thornton Gary A | $15,000 | Chicago Title | |
| Wells Fargo Bank Na | -- | None Available | |
| Forrester Jeffrey Scott | -- | Metro East |
Source: Public Records
Mortgage History
| Date | Status | Borrower | Loan Amount |
|---|---|---|---|
| Open | Krause George A | $51,300 | |
| Previous Owner | Thornton Gary A | $25,000 |
Source: Public Records
Tax History
| Year | Tax Paid | Tax Assessment Tax Assessment Total Assessment is a certain percentage of the fair market value that is determined by local assessors to be the total taxable value of land and additions on the property. | Land | Improvement |
|---|---|---|---|---|
| 2024 | $1,626 | $20,386 | $2,129 | $18,257 |
| 2023 | $1,562 | $19,256 | $2,011 | $17,245 |
| 2022 | $1,534 | $17,224 | $1,922 | $15,302 |
| 2021 | $1,540 | $16,313 | $1,820 | $14,493 |
| 2020 | $1,576 | $16,836 | $1,878 | $14,958 |
| 2019 | $1,576 | $16,836 | $1,878 | $14,958 |
| 2018 | $1,648 | $16,369 | $1,870 | $14,499 |
| 2017 | $1,631 | $15,988 | $1,826 | $14,162 |
| 2016 | $1,616 | $16,145 | $1,844 | $14,301 |
| 2014 | $743 | $15,958 | $3,134 | $12,824 |
| 2013 | $1,502 | $16,580 | $3,256 | $13,324 |
Source: Public Records
Map
Nearby Homes
- 712 N Main St
- 120 N Euclid Ave
- 427 East Dr
- 107 N Euclid Ave
- 434 East Dr
- 300 W Mill St Unit 37
- 309 S Euclid Ave
- 401 S Park St
- 715 S Hamilton St
- 801 S Main St
- 801 S Borders Ave
- 800 S Richard Ave
- 620 E Reily St
- 1365 Green Diamond Rd
- 240 Taft St
- 143 Taft St
- 4 W Church St
- 120 S Charles St
- 000 Darmstadt Rd
- 9345 Schaller Rd
Your Personal Tour Guide
Ask me questions while you tour the home.