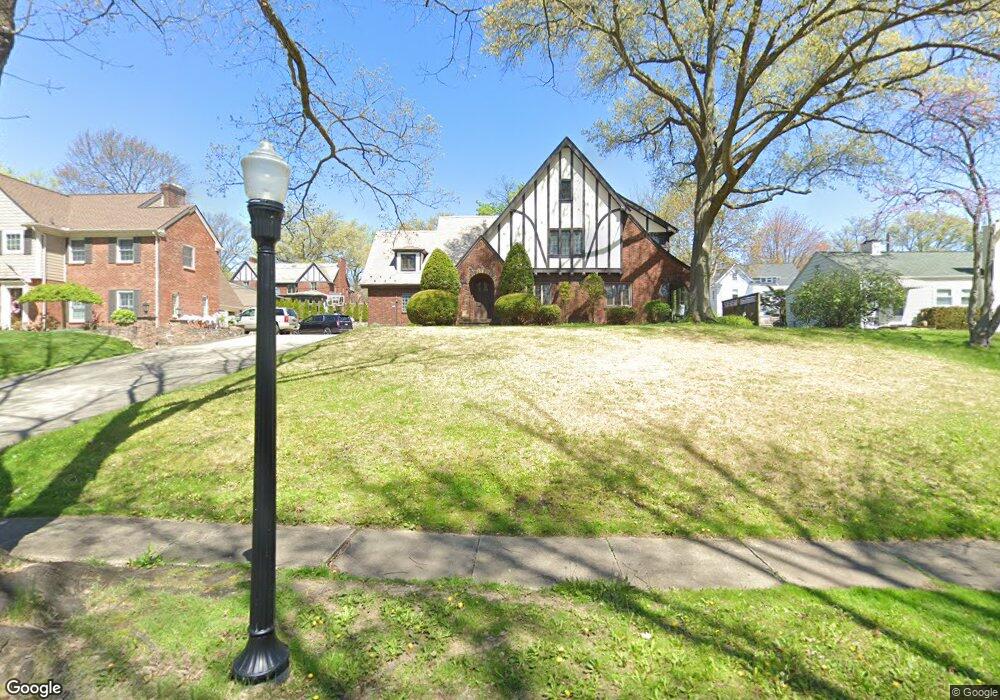
701 Palisades Dr Akron, OH 44303
Merriman Hills NeighborhoodEstimated Value: $285,000 - $377,000
4
Beds
3
Baths
2,444
Sq Ft
$142/Sq Ft
Est. Value
About This Home
This home is located at 701 Palisades Dr, Akron, OH 44303 and is currently estimated at $347,536, approximately $142 per square foot. 701 Palisades Dr is a home located in Summit County with nearby schools including King Community Learning Center, Towpath Trail High School, and Our Lady Of The Elms Elementary School.
Ownership History
Date
Name
Owned For
Owner Type
Purchase Details
Closed on
Feb 27, 2008
Sold by
Deutsche Bank National Trust Co
Bought by
Ferry Kevin and Stein Jennifer L
Current Estimated Value
Home Financials for this Owner
Home Financials are based on the most recent Mortgage that was taken out on this home.
Original Mortgage
$139,080
Outstanding Balance
$86,691
Interest Rate
5.75%
Mortgage Type
Purchase Money Mortgage
Estimated Equity
$260,845
Purchase Details
Closed on
Jul 12, 2007
Sold by
Bartelme Richard L
Bought by
Deutsche Bank National Trust Co and Registered Holders Of Equifirst Mortgage
Purchase Details
Closed on
May 29, 2002
Sold by
Leatherman Mary R and Simpson Patricia
Bought by
Bartelme Richard L and Bartelme Richard
Home Financials for this Owner
Home Financials are based on the most recent Mortgage that was taken out on this home.
Original Mortgage
$157,500
Interest Rate
7%
Create a Home Valuation Report for This Property
The Home Valuation Report is an in-depth analysis detailing your home's value as well as a comparison with similar homes in the area
Home Values in the Area
Average Home Value in this Area
Purchase History
| Date | Buyer | Sale Price | Title Company |
|---|---|---|---|
| Ferry Kevin | $146,400 | Us Land Title Llc | |
| Deutsche Bank National Trust Co | $140,000 | None Available | |
| Bartelme Richard L | $175,000 | Midland Commerce Group |
Source: Public Records
Mortgage History
| Date | Status | Borrower | Loan Amount |
|---|---|---|---|
| Open | Ferry Kevin | $139,080 | |
| Previous Owner | Bartelme Richard L | $157,500 |
Source: Public Records
Tax History Compared to Growth
Tax History
| Year | Tax Paid | Tax Assessment Tax Assessment Total Assessment is a certain percentage of the fair market value that is determined by local assessors to be the total taxable value of land and additions on the property. | Land | Improvement |
|---|---|---|---|---|
| 2025 | $5,417 | $102,319 | $18,991 | $83,328 |
| 2024 | $5,417 | $102,319 | $18,991 | $83,328 |
| 2023 | $5,417 | $102,319 | $18,991 | $83,328 |
| 2022 | $5,300 | $78,607 | $14,389 | $64,218 |
| 2021 | $5,305 | $78,607 | $14,389 | $64,218 |
| 2020 | $5,225 | $78,610 | $14,390 | $64,220 |
| 2019 | $4,685 | $63,750 | $11,410 | $52,340 |
| 2018 | $4,622 | $63,750 | $11,410 | $52,340 |
| 2017 | $4,696 | $63,750 | $11,410 | $52,340 |
| 2016 | $4,699 | $63,750 | $11,410 | $52,340 |
| 2015 | $4,696 | $63,750 | $11,410 | $52,340 |
| 2014 | $4,658 | $63,750 | $11,410 | $52,340 |
| 2013 | $3,797 | $52,730 | $11,410 | $41,320 |
Source: Public Records
Map
Nearby Homes
- 754 Merriman Rd
- 652 Palisades Dr
- 0 Belleau Wood Dr
- 791 Lafayette Dr
- 869 Westgrove Rd
- 430 Delaware Ave
- 400 Delaware Ave
- 856 Lafayette Dr
- 481 Letchworth Dr
- 770 Canyon Trail
- 333 N Portage Path Unit 34
- 333 N Portage Path Unit 6
- 275 N Portage Path Unit 5A
- 889 Eaton Ave
- 1056 Garman Rd
- 709 Wellesley Ave
- 834 Eaton Park Ln
- 225 N Highland Ave
- 427 Kathleen St
- 215 Casterton Ave
- 693 Palisades Dr
- 685 Palisades Dr
- 685 Palisades Dr
- 715 Palisades Dr
- 700 Sunnyside Ave
- 692 Sunnyside Ave
- 714 Sunnyside Ave
- 723 Palisades Dr
- 704 Palisades Dr
- 696 Palisades Dr
- 684 Sunnyside Ave
- 712 Palisades Dr
- 722 Sunnyside Ave
- 676 Sunnyside Ave
- 720 Palisades Dr
- 682 Palisades Dr
- 669 Palisades Dr
- 687 Sunnyside Ave
- 737 Merriman Rd