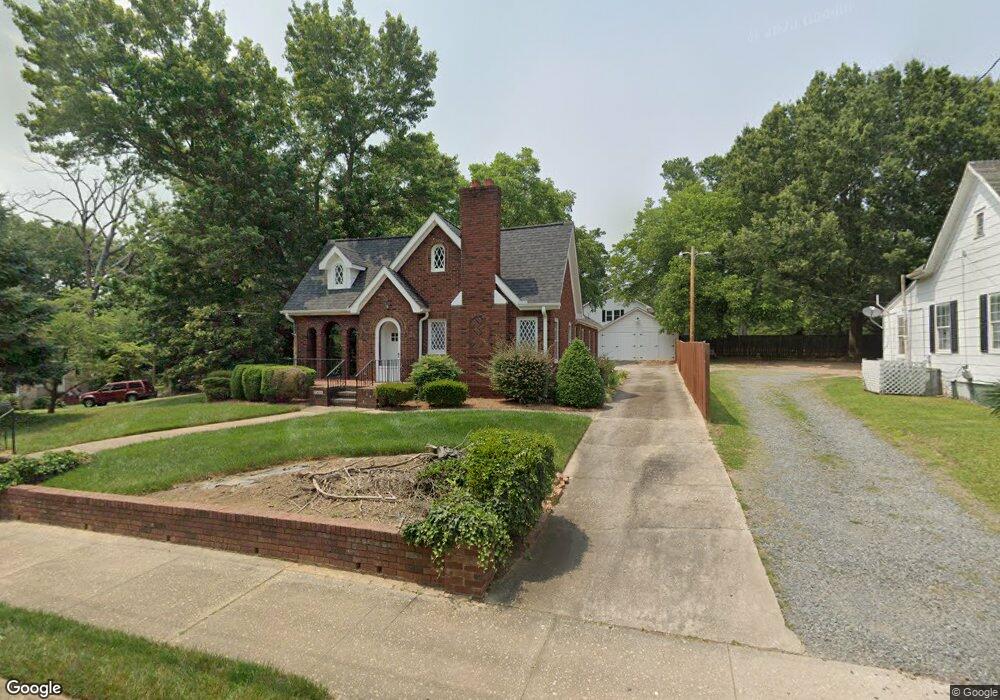
701 Pee Dee Ave Albemarle, NC 28001
Estimated Value: $237,000 - $292,000
2
Beds
1
Bath
2,064
Sq Ft
$132/Sq Ft
Est. Value
About This Home
This home is located at 701 Pee Dee Ave, Albemarle, NC 28001 and is currently estimated at $271,703, approximately $131 per square foot. 701 Pee Dee Ave is a home located in Stanly County with nearby schools including Central Elementary School, Albemarle Middle School, and Albemarle High School.
Ownership History
Date
Name
Owned For
Owner Type
Purchase Details
Closed on
Feb 8, 2008
Sold by
Huneycutt Bartley S and Huneycutt Julia J
Bought by
Huneycutt Bartley S
Current Estimated Value
Purchase Details
Closed on
Feb 8, 2007
Sold by
Miller Kevin C and Miller Katie A
Bought by
Huneycutt Bratley S and Huneycutt Julia J
Home Financials for this Owner
Home Financials are based on the most recent Mortgage that was taken out on this home.
Original Mortgage
$89,600
Outstanding Balance
$53,696
Interest Rate
6.17%
Mortgage Type
New Conventional
Estimated Equity
$218,007
Purchase Details
Closed on
Mar 28, 2005
Sold by
Thompson Douglas R and Thompson Sharon C
Bought by
Miller Kevin C and Miller Katie A
Home Financials for this Owner
Home Financials are based on the most recent Mortgage that was taken out on this home.
Original Mortgage
$82,000
Interest Rate
5.12%
Mortgage Type
Adjustable Rate Mortgage/ARM
Create a Home Valuation Report for This Property
The Home Valuation Report is an in-depth analysis detailing your home's value as well as a comparison with similar homes in the area
Purchase History
| Date | Buyer | Sale Price | Title Company |
|---|---|---|---|
| Huneycutt Bartley S | -- | None Available | |
| Huneycutt Bratley S | $112,000 | None Available | |
| Miller Kevin C | $103,000 | None Available |
Source: Public Records
Mortgage History
| Date | Status | Borrower | Loan Amount |
|---|---|---|---|
| Open | Huneycutt Bratley S | $89,600 | |
| Previous Owner | Miller Kevin C | $82,000 |
Source: Public Records
Tax History
| Year | Tax Paid | Tax Assessment Tax Assessment Total Assessment is a certain percentage of the fair market value that is determined by local assessors to be the total taxable value of land and additions on the property. | Land | Improvement |
|---|---|---|---|---|
| 2025 | $2,313 | $206,552 | $21,630 | $184,922 |
| 2024 | $1,398 | $128,554 | $15,141 | $113,413 |
| 2023 | $1,202 | $128,554 | $15,141 | $113,413 |
| 2022 | $1,568 | $128,554 | $15,141 | $113,413 |
| 2021 | $1,568 | $128,554 | $15,141 | $113,413 |
| 2020 | $1,502 | $115,784 | $12,978 | $102,806 |
| 2019 | $1,517 | $115,784 | $12,978 | $102,806 |
| 2018 | $1,181 | $115,784 | $12,978 | $102,806 |
| 2017 | $1,459 | $115,784 | $12,978 | $102,806 |
| 2016 | $1,364 | $108,251 | $12,978 | $95,273 |
| 2015 | $1,378 | $108,251 | $12,978 | $95,273 |
| 2014 | $1,244 | $108,251 | $12,978 | $95,273 |
Source: Public Records
Map
Nearby Homes
- 729 Montgomery Ave
- 420 Spring St
- 701 E Oakwood Ave
- 436 E Oakwood Ave
- 1035 Pee Dee Ave
- 274 N 4th St
- 905 Elizabeth Ave
- 1051 Pee Dee Ave
- 507 N 5th St
- 320 T E White Sr Dr
- 1105 E Main St
- 306 Dunlap St
- 142 S Morrow Ave
- 114 S 5th St
- 1025 Martin Luther King Junior Dr
- 1126 Pee Dee Ave
- 1116 Montgomery Ave
- 815 Sherwood Ave
- 1132 E Main St
- 627 N 6th St
- 707 Pee Dee Ave
- 221 N 7th St Unit 223
- 625 Pee Dee Ave
- 220 N 7th St
- 225 N 7th St
- 224 N 7th St
- 621 Pee Dee Ave
- 714 Brown Ave
- 226 N 7th St
- 716 Brown Ave Unit 718
- 723 Pee Dee Ave
- 617 Pee Dee Ave
- 718 Brown Ave
- 121 N 7th St
- 640 Pee Dee Ave
- 620 Pee Dee Ave
- 720 Brown Ave Unit 722
- 302 N 7th St
- 611 Pee Dee Ave
- 0 Brown Ave
Your Personal Tour Guide
Ask me questions while you tour the home.