Estimated Value: $169,646 - $197,000
3
Beds
2
Baths
1,378
Sq Ft
$136/Sq Ft
Est. Value
About This Home
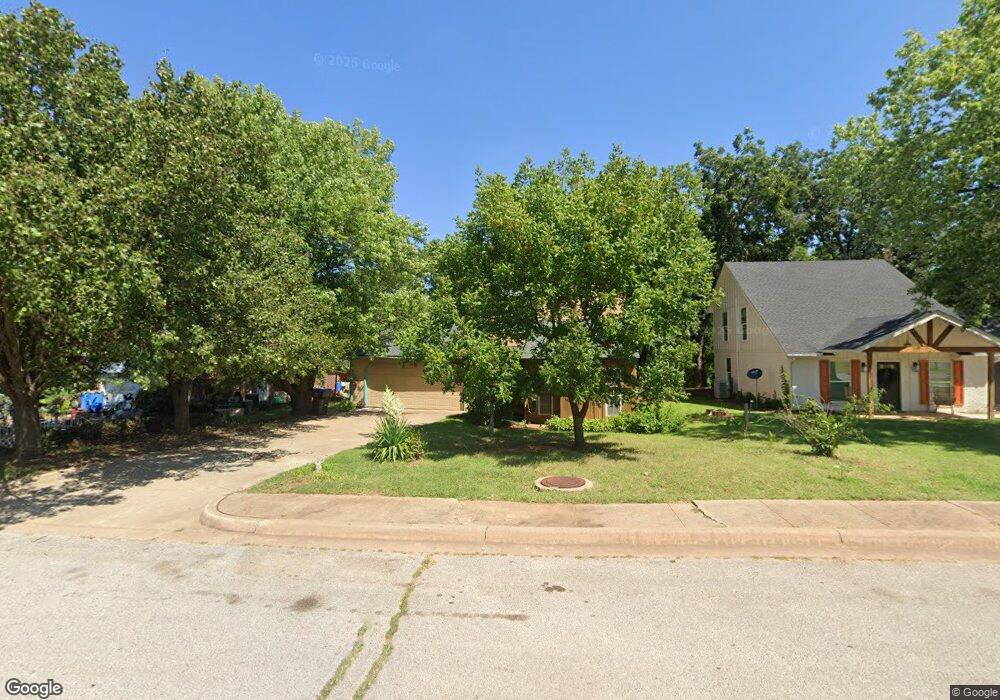
This home is located at 701 Rolling Meadow, Noble, OK 73068 and is currently estimated at $187,162, approximately $135 per square foot. 701 Rolling Meadow is a home located in Cleveland County with nearby schools including Katherine I. Daily Elementary School, Pioneer Intermediate Elementary School, and John K. Hubbard Elementary School.
Ownership History
Date
Name
Owned For
Owner Type
Purchase Details
Closed on
May 5, 2022
Sold by
Smoot Melissa L
Bought by
Smoot Melissa L and Schultz Whitney Helen
Current Estimated Value
Purchase Details
Closed on
Mar 25, 2008
Sold by
Dittmar Kathryn L
Bought by
Smoot Melissa L
Home Financials for this Owner
Home Financials are based on the most recent Mortgage that was taken out on this home.
Original Mortgage
$86,734
Interest Rate
5.72%
Mortgage Type
New Conventional
Purchase Details
Closed on
Jul 1, 2005
Sold by
Rolling Meadows Development Llc
Bought by
Touchstone Homes Llc
Home Financials for this Owner
Home Financials are based on the most recent Mortgage that was taken out on this home.
Original Mortgage
$119,579
Interest Rate
5.64%
Mortgage Type
Construction
Create a Home Valuation Report for This Property
The Home Valuation Report is an in-depth analysis detailing your home's value as well as a comparison with similar homes in the area
Home Values in the Area
Average Home Value in this Area
Purchase History
| Date | Buyer | Sale Price | Title Company |
|---|---|---|---|
| Smoot Melissa L | -- | None Listed On Document | |
| Smoot Melissa L | $85,000 | None Available | |
| Touchstone Homes Llc | $17,500 | None Available |
Source: Public Records
Mortgage History
| Date | Status | Borrower | Loan Amount |
|---|---|---|---|
| Previous Owner | Smoot Melissa L | $86,734 | |
| Previous Owner | Touchstone Homes Llc | $119,579 |
Source: Public Records
Tax History
| Year | Tax Paid | Tax Assessment Tax Assessment Total Assessment is a certain percentage of the fair market value that is determined by local assessors to be the total taxable value of land and additions on the property. | Land | Improvement |
|---|---|---|---|---|
| 2025 | $1,373 | $12,394 | $2,384 | $10,010 |
| 2024 | $1,298 | $12,033 | $2,381 | $9,652 |
| 2023 | $1,274 | $11,683 | $2,498 | $9,185 |
| 2022 | $1,207 | $11,343 | $2,417 | $8,926 |
| 2021 | $1,112 | $11,012 | $1,440 | $9,572 |
| 2020 | $1,130 | $11,012 | $1,440 | $9,572 |
| 2019 | $1,164 | $11,012 | $1,440 | $9,572 |
| 2018 | $1,151 | $10,991 | $1,437 | $9,554 |
| 2017 | $1,071 | $11,013 | $0 | $0 |
| 2016 | $1,047 | $10,360 | $1,355 | $9,005 |
| 2015 | $980 | $10,058 | $1,315 | $8,743 |
| 2014 | $929 | $9,765 | $1,440 | $8,325 |
Source: Public Records
Map
Nearby Homes
- 705 Rolling Meadow Dr
- 604 Silver Maple Ln
- 601 Holsey Dr
- 521 Hillsboro Rd
- 517 Hillsboro Rd
- 510 Holsey Dr
- 305 Treyton Place
- 805 Condor Ct
- 1109 Moonshine Ct
- 505 Willis St
- 209 W Etowah Rd
- 501 N 5th St
- 414 N 8th St
- 511 N 2nd St
- 661 Lakeside Dr
- 411 Riverview Dr
- 314 N Front St
- 209 Juniper Cir
- 1102 Azalea Farms Rd
- 4081 Cedar Farm Rd
- 609 Rolling Meadow
- 703 Rolling Meadow
- 605 Rolling Meadow
- 614 Silver Maple Ct
- 1306 Rolling Woods
- 707 Rolling Meadow
- 612 Silver Maple Ct
- 603 Rolling Meadow
- 603 Rolling Meadow Dr
- 1304 Rolling Woods
- 709 Rolling Meadow
- 610 Silver Maple Ct
- 1307 Rolling Woods
- 606 Silver Maple Ct
- 601 Rolling Meadow
- 1302 Rolling Woods
- 608 Silver Maple Ct
- 1305 Rolling Woods
- 611 Silver Maple Ln
- 1309 Silver Maple Ln
Your Personal Tour Guide
Ask me questions while you tour the home.