701 S 51st St Temple, TX 76504
West Temple NeighborhoodEstimated payment $7,384/month
About This Lot
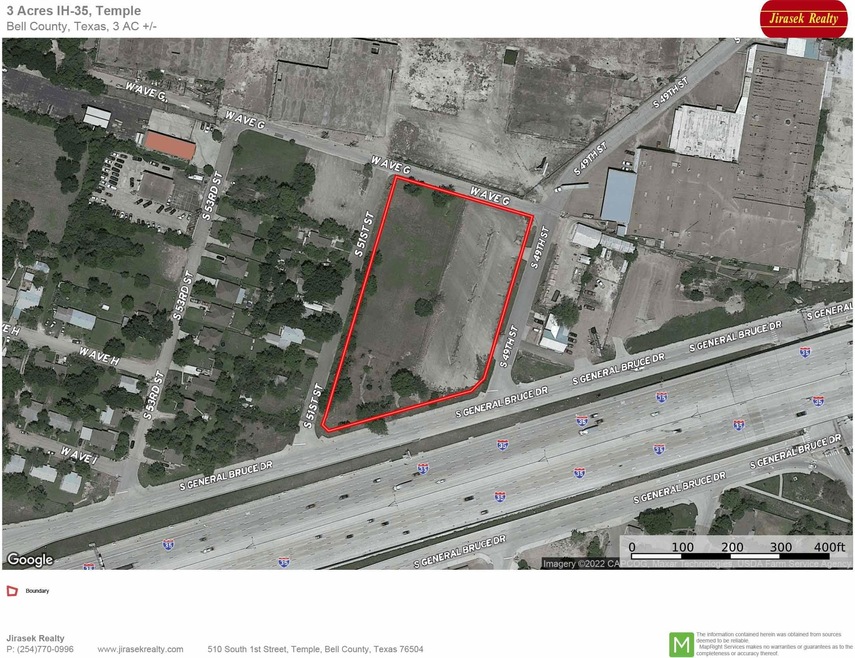
DESCRIPTION: 2.95 Acre Retail/Mixed-Use Development Site on IH-35 & S 51st Street, Temple.
LAND USE: Retail, Restaurant / QSR, Hospitality, Mixed-Use.
ACCESS: Road Frontage on Four Sides: S General Bruce, S 49th, S 51st, W Ave G. Two Points of Access on S 49th Street.
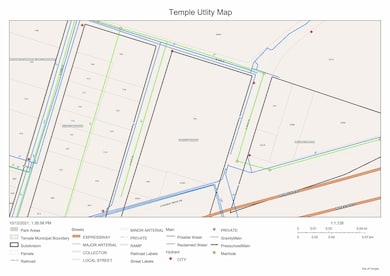
UTILITIES: Public Utilities on-Site. City of Temple Water on 4-Sides & Sewer on 3-Sides; Oncor Electric on-Site.
TOPOGRAPHY: Previously Developed Site. Small Slope towards IH-35. Partial Asphalt Ground Cover.
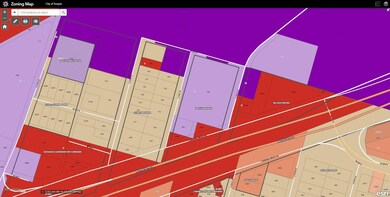
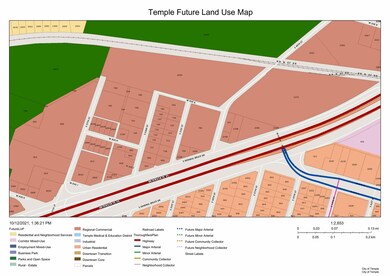
ZONING: Part C-Commercial, part LI-Light Industrial. Future Land Use shows Regional Commercial. IH-35 Retail Overlay District.
TAXES: $10,341.16 (2025)
REMARKS: Will Consider Dividing. Adjacent 11.23 acres also available for sale. Call for details.
PRICE: $1,200,000 ($9.34/sf).
Listing Agent
Jeremy CCIM
JIRASEK REALTY, LLC License #9010446 Listed on: 01/09/2023

Property Details
Property Type
- Land
Est. Annual Taxes
- $12,708
Lot Details
- Current uses include hospitality
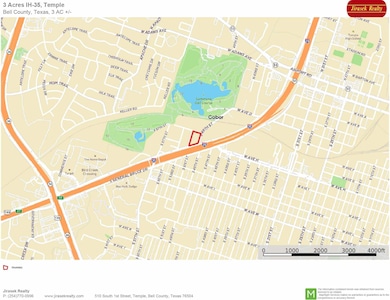
Map
Home Values in the Area
Average Home Value in this Area
Tax History
| Year | Tax Paid | Tax Assessment Tax Assessment Total Assessment is a certain percentage of the fair market value that is determined by local assessors to be the total taxable value of land and additions on the property. | Land | Improvement |
|---|---|---|---|---|
| 2025 | $12,708 | $433,105 | $349,067 | $84,038 |
| 2024 | $12,708 | $543,479 | $336,186 | $207,293 |
| 2023 | $11,653 | $508,250 | $306,560 | $201,690 |
| 2022 | $1,985 | $82,891 | $64,403 | $18,488 |
| 2021 | $1,844 | $71,861 | $56,062 | $15,799 |
| 2020 | $1,898 | $70,741 | $56,062 | $14,679 |
| 2019 | $1,838 | $67,267 | $56,062 | $11,205 |
| 2018 | $1,854 | $67,267 | $56,062 | $11,205 |
| 2017 | $1,842 | $67,267 | $56,062 | $11,205 |
| 2016 | $1,842 | $67,267 | $56,062 | $11,205 |
| 2014 | -- | $67,267 | $0 | $0 |
Property History
| Date | Event | Price | List to Sale | Price per Sq Ft |
|---|---|---|---|---|
| 09/30/2025 09/30/25 | Price Changed | $1,200,000 | -14.3% | -- |
| 01/09/2023 01/09/23 | For Sale | $1,400,000 | -- | -- |
Purchase History
| Date | Type | Sale Price | Title Company |
|---|---|---|---|
| Special Warranty Deed | -- | New Title Company Name | |
| Gift Deed | -- | Centraland Title Co |
- 1103 S 49th St
- 1108 S 47th St
- 414 Keller Rd
- 1315 S 51st St
- 410 Phoenix Dr
- 2109 W Avenue B
- 2109 W Avenue B Unit A and B
- 1505 S 49th St
- 2918 Antelope Trail
- 3104 Antelope Trail
- 920 S 33rd St
- 3210 S General Bruce Dr
- 13 N 41st St
- 1612 S 49th St
- 14 N 41st St
- 1709 W Avenue C
- 1704 S 41st St
- 1603 W Avenue C
- 1001 S 29th St
- 1718 S 39th St
- 3007 Antelope Trail
- 1804 W Avenue H Unit D
- 1802 W Avenue H Unit C
- 1118 S 51st St Unit B
- 25 N 43rd St Unit 23
- 3010 Ira Young Dr
- 2803 Ira Young Dr
- 3009 Ira Young Dr
- 3000 W Adams Ave
- 3550 SW H K Dodgen Loop
- 3827 Leming Ct
- 306 S 23rd St Unit A
- 306 S 23rd St Unit B
- 1303 Antelope Trail Unit B
- 2504 Saulsbury Dr
- 2624 Saulsbury Dr
- 1122 Campbellton Dr
- 2417 Valley Forge Ave Unit A
- 2409 Valley Forge Ave
- 4022 Keller Rd Unit B