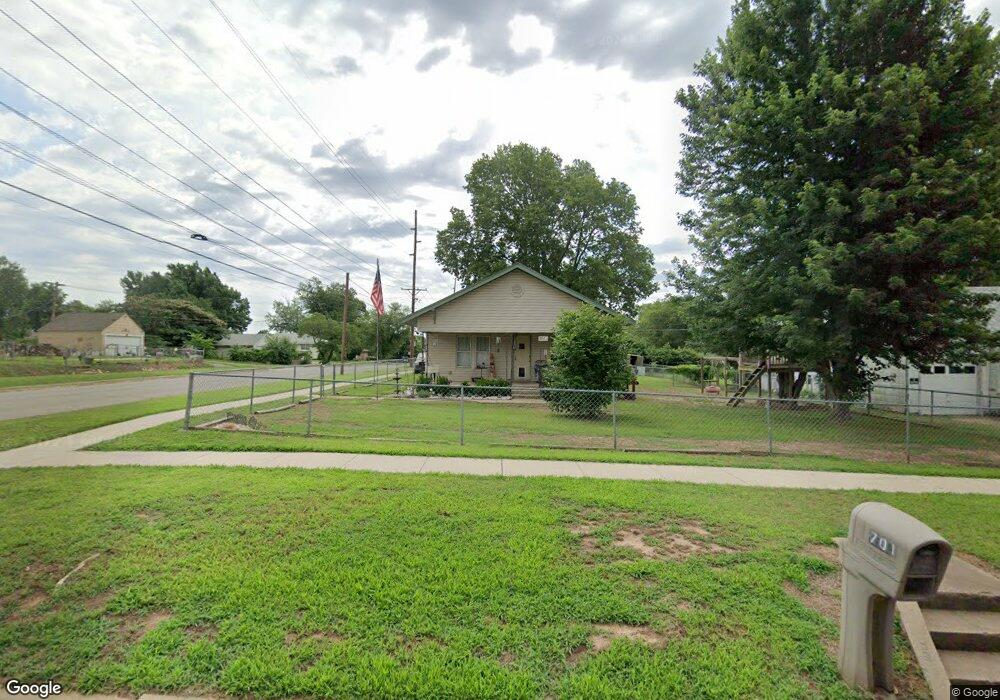
701 S 9th St Ponca City, OK 74601
Estimated Value: $60,985 - $105,000
2
Beds
1
Bath
1,128
Sq Ft
$76/Sq Ft
Est. Value
About This Home
This home is located at 701 S 9th St, Ponca City, OK 74601 and is currently estimated at $85,246, approximately $75 per square foot. 701 S 9th St is a home located in Kay County with nearby schools including Garfield Elementary School, Ponca City East Middle School, and Ponca City West Middle School.
Ownership History
Date
Name
Owned For
Owner Type
Purchase Details
Closed on
Jun 26, 2018
Sold by
Froese Mary Elizabeth and Fike Mary Elizabeth
Bought by
Rainwater James C
Current Estimated Value
Home Financials for this Owner
Home Financials are based on the most recent Mortgage that was taken out on this home.
Original Mortgage
$65,000
Outstanding Balance
$56,457
Interest Rate
4.6%
Mortgage Type
VA
Estimated Equity
$28,789
Purchase Details
Closed on
Feb 25, 2002
Sold by
Richard Chitwood
Bought by
Mary E Froese
Purchase Details
Closed on
Aug 16, 2000
Sold by
Zudora Busey
Bought by
Zudora Zudora B and Zudora Chitwood
Purchase Details
Closed on
Sep 21, 1998
Sold by
Zudora B Busey
Bought by
Martin Zudora B and Martin P
Purchase Details
Closed on
Apr 17, 1996
Bought by
Zudora B Busey
Purchase Details
Closed on
Feb 8, 1994
Bought by
Isenberg James W and Isenberg Mary E
Create a Home Valuation Report for This Property
The Home Valuation Report is an in-depth analysis detailing your home's value as well as a comparison with similar homes in the area
Home Values in the Area
Average Home Value in this Area
Purchase History
| Date | Buyer | Sale Price | Title Company |
|---|---|---|---|
| Rainwater James C | $65,000 | Stewart Escrow & Title | |
| Mary E Froese | $32,000 | -- | |
| Zudora Zudora B | -- | -- | |
| Zudora B Busey | -- | -- | |
| Martin Zudora B | -- | -- | |
| Zudora B Busey | $34,000 | -- | |
| Isenberg James W | $10,500 | -- |
Source: Public Records
Mortgage History
| Date | Status | Borrower | Loan Amount |
|---|---|---|---|
| Open | Rainwater James C | $65,000 |
Source: Public Records
Tax History Compared to Growth
Tax History
| Year | Tax Paid | Tax Assessment Tax Assessment Total Assessment is a certain percentage of the fair market value that is determined by local assessors to be the total taxable value of land and additions on the property. | Land | Improvement |
|---|---|---|---|---|
| 2024 | -- | $5,820 | $948 | $4,872 |
| 2023 | $553 | $5,736 | $948 | $4,788 |
| 2022 | $689 | $7,244 | $948 | $6,296 |
| 2021 | $693 | $7,244 | $948 | $6,296 |
| 2020 | $686 | $7,244 | $948 | $6,296 |
| 2019 | $683 | $7,150 | $948 | $6,202 |
| 2018 | $250 | $3,579 | $416 | $3,163 |
| 2017 | $254 | $3,590 | $416 | $3,174 |
| 2016 | $257 | $3,595 | $416 | $3,179 |
| 2015 | $248 | $3,490 | $416 | $3,074 |
| 2014 | $242 | $3,478 | $416 | $3,062 |
Source: Public Records
Map
Nearby Homes
- 701 S 8th St
- 800 S 12th St
- 1001 S 9th St
- 310 S 9th St
- 815 E Madison Ave
- 1020 S 8th St
- 1103 S 6th St
- 1104 E Central Ave
- 1220 S 8th St Unit 480
- 408 S 4th St
- 1300 S 8th St
- 1218 S 6th St
- 212 E Ponca Ave
- 1409 S 8th St
- 417 S 2nd St
- 202 N 7th St
- 213 N 10th St
- 216 N 12th St Unit 840
- 310 N 7th St Unit 660
- 409 N 5th St