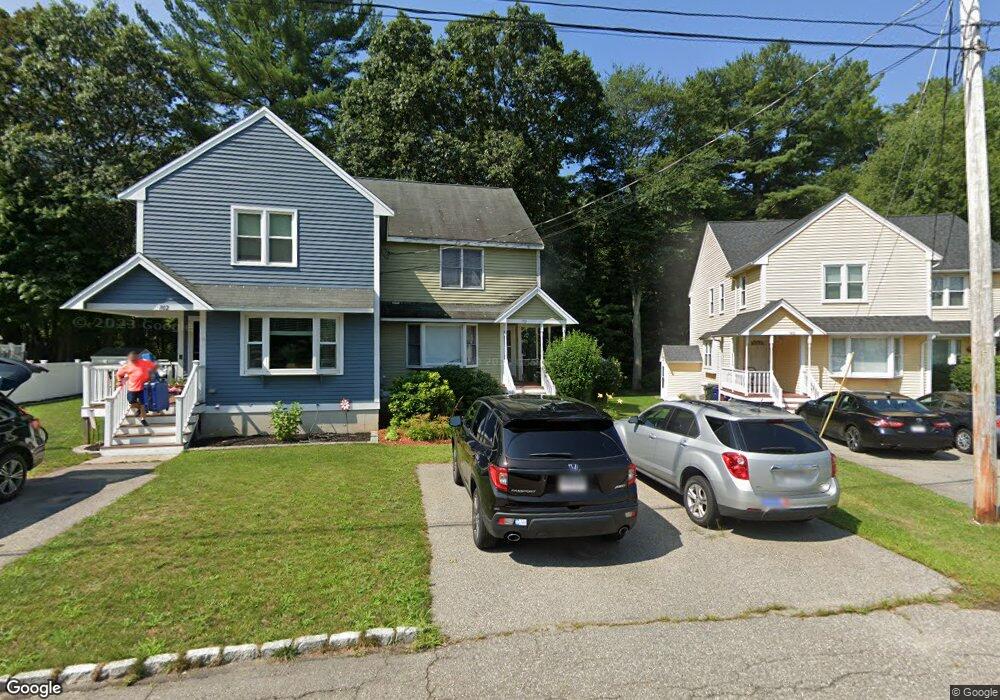
701 Sandy Ln Wilmington, MA 01887
Estimated Value: $483,000 - $707,000
3
Beds
2
Baths
1,437
Sq Ft
$407/Sq Ft
Est. Value
About This Home
This home is located at 701 Sandy Ln, Wilmington, MA 01887 and is currently estimated at $584,600, approximately $406 per square foot. 701 Sandy Ln is a home located in Middlesex County with nearby schools including Wilmington Middle School and Wilmington High School.
Ownership History
Date
Name
Owned For
Owner Type
Purchase Details
Closed on
Aug 1, 2007
Sold by
Contrada Lucy and Contrada Robert
Bought by
Dancewicz Celia M
Current Estimated Value
Home Financials for this Owner
Home Financials are based on the most recent Mortgage that was taken out on this home.
Original Mortgage
$189,600
Outstanding Balance
$120,474
Interest Rate
6.73%
Mortgage Type
Purchase Money Mortgage
Estimated Equity
$464,126
Purchase Details
Closed on
May 19, 1997
Sold by
Shawsheen River Est Lp
Bought by
Contrada Robert
Home Financials for this Owner
Home Financials are based on the most recent Mortgage that was taken out on this home.
Original Mortgage
$90,250
Interest Rate
8.12%
Mortgage Type
Purchase Money Mortgage
Create a Home Valuation Report for This Property
The Home Valuation Report is an in-depth analysis detailing your home's value as well as a comparison with similar homes in the area
Home Values in the Area
Average Home Value in this Area
Purchase History
| Date | Buyer | Sale Price | Title Company |
|---|---|---|---|
| Dancewicz Celia M | $212,080 | -- | |
| Contrada Robert | $95,000 | -- |
Source: Public Records
Mortgage History
| Date | Status | Borrower | Loan Amount |
|---|---|---|---|
| Open | Dancewicz Celia M | $189,600 | |
| Previous Owner | Contrada Robert | $90,250 | |
| Previous Owner | Contrada Robert | $5,796 |
Source: Public Records
Tax History Compared to Growth
Tax History
| Year | Tax Paid | Tax Assessment Tax Assessment Total Assessment is a certain percentage of the fair market value that is determined by local assessors to be the total taxable value of land and additions on the property. | Land | Improvement |
|---|---|---|---|---|
| 2025 | $3,575 | $312,200 | $141,600 | $170,600 |
| 2024 | $3,471 | $303,700 | $141,600 | $162,100 |
| 2023 | $3,315 | $277,600 | $128,700 | $148,900 |
| 2022 | $3,360 | $257,900 | $107,300 | $150,600 |
| 2021 | $3,194 | $230,800 | $97,500 | $133,300 |
| 2020 | $3,299 | $242,900 | $154,800 | $88,100 |
| 2019 | $3,340 | $242,900 | $147,400 | $95,500 |
| 2018 | $3,500 | $242,900 | $140,400 | $102,500 |
| 2017 | $3,510 | $242,900 | $133,700 | $109,200 |
| 2016 | $3,394 | $232,000 | $127,300 | $104,700 |
| 2015 | $3,192 | $222,100 | $127,300 | $94,800 |
| 2014 | $3,163 | $222,100 | $121,200 | $100,900 |
Source: Public Records
Map
Nearby Homes