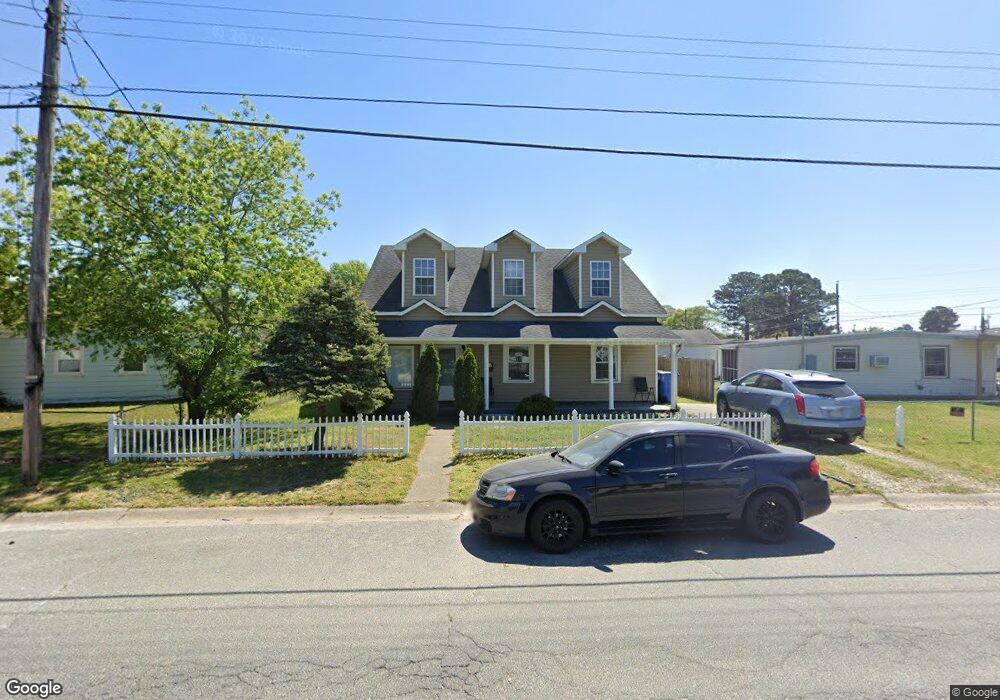
701 Stalham Rd Chesapeake, VA 23325
Indian River NeighborhoodEstimated Value: $323,000 - $372,000
4
Beds
3
Baths
2,232
Sq Ft
$160/Sq Ft
Est. Value
About This Home
This home is located at 701 Stalham Rd, Chesapeake, VA 23325 and is currently estimated at $357,826, approximately $160 per square foot. 701 Stalham Rd is a home located in Chesapeake City with nearby schools including Thurgood Marshall Elementary School, Indian River Middle, and Indian River High.
Ownership History
Date
Name
Owned For
Owner Type
Purchase Details
Closed on
Apr 25, 2017
Sold by
Adams Gary A and Adams Adams
Bought by
Bogan Autumn
Current Estimated Value
Home Financials for this Owner
Home Financials are based on the most recent Mortgage that was taken out on this home.
Original Mortgage
$178,825
Outstanding Balance
$149,323
Interest Rate
4.25%
Mortgage Type
FHA
Estimated Equity
$208,503
Purchase Details
Closed on
Apr 9, 2012
Sold by
Smith Sandra D
Bought by
Simmons Keema D
Home Financials for this Owner
Home Financials are based on the most recent Mortgage that was taken out on this home.
Original Mortgage
$126,250
Interest Rate
4.4%
Mortgage Type
FHA
Purchase Details
Closed on
Apr 19, 2010
Sold by
Deutsche Bnak Ntl Tr Co As Tr
Bought by
Goff Property Management Inc
Purchase Details
Closed on
Aug 19, 2009
Sold by
Glasser and Mcneal David P
Bought by
Deutsche Bank Nat'L Trust
Purchase Details
Closed on
Aug 25, 2006
Sold by
Mcneal David P
Bought by
Mcneal David P
Create a Home Valuation Report for This Property
The Home Valuation Report is an in-depth analysis detailing your home's value as well as a comparison with similar homes in the area
Home Values in the Area
Average Home Value in this Area
Purchase History
| Date | Buyer | Sale Price | Title Company |
|---|---|---|---|
| Bogan Autumn | $185,000 | Attorney | |
| Simmons Keema D | $135,000 | -- | |
| Goff Property Management Inc | $44,000 | -- | |
| Deutsche Bank Nat'L Trust | $124,000 | -- | |
| Mcneal David P | $295,500 | -- |
Source: Public Records
Mortgage History
| Date | Status | Borrower | Loan Amount |
|---|---|---|---|
| Open | Bogan Autumn | $178,825 | |
| Previous Owner | Simmons Keema D | $126,250 |
Source: Public Records
Tax History Compared to Growth
Tax History
| Year | Tax Paid | Tax Assessment Tax Assessment Total Assessment is a certain percentage of the fair market value that is determined by local assessors to be the total taxable value of land and additions on the property. | Land | Improvement |
|---|---|---|---|---|
| 2025 | $3,245 | $343,100 | $100,000 | $243,100 |
| 2024 | $3,245 | $321,300 | $90,000 | $231,300 |
| 2023 | $2,707 | $304,300 | $80,000 | $224,300 |
| 2022 | $2,689 | $266,200 | $65,000 | $201,200 |
| 2021 | $2,378 | $226,500 | $55,000 | $171,500 |
| 2020 | $2,277 | $216,900 | $55,000 | $161,900 |
| 2019 | $2,199 | $209,400 | $55,000 | $154,400 |
| 2018 | $1,855 | $164,300 | $50,000 | $114,300 |
| 2017 | $1,803 | $171,700 | $50,000 | $121,700 |
| 2016 | $1,725 | $164,300 | $50,000 | $114,300 |
| 2015 | $1,700 | $161,900 | $50,000 | $111,900 |
| 2014 | $1,700 | $161,900 | $50,000 | $111,900 |
Source: Public Records
Map
Nearby Homes
- 305 Keith Ct
- 3005 Scotia Dr
- 708 Stalham Rd
- 506 Stalham Rd
- 2915 Berkley Ave
- 2904 Berkley Ave
- 2836 Parkside Dr
- 502 Mooney Rd
- 3006 Menands Dr
- 402 Stalham Rd Unit A
- 1330 Wingfield Ave
- 2702 Cayce Dr
- 2603 Berkley Ave
- 1317 Yeadon Rd
- 3303 Rokeby Ave
- 1309 Drayton Rd
- 1504 Chestnut Ave
- 2929 Hilton Ave
- Lot Angora Dr
- 2916 Doris Ave