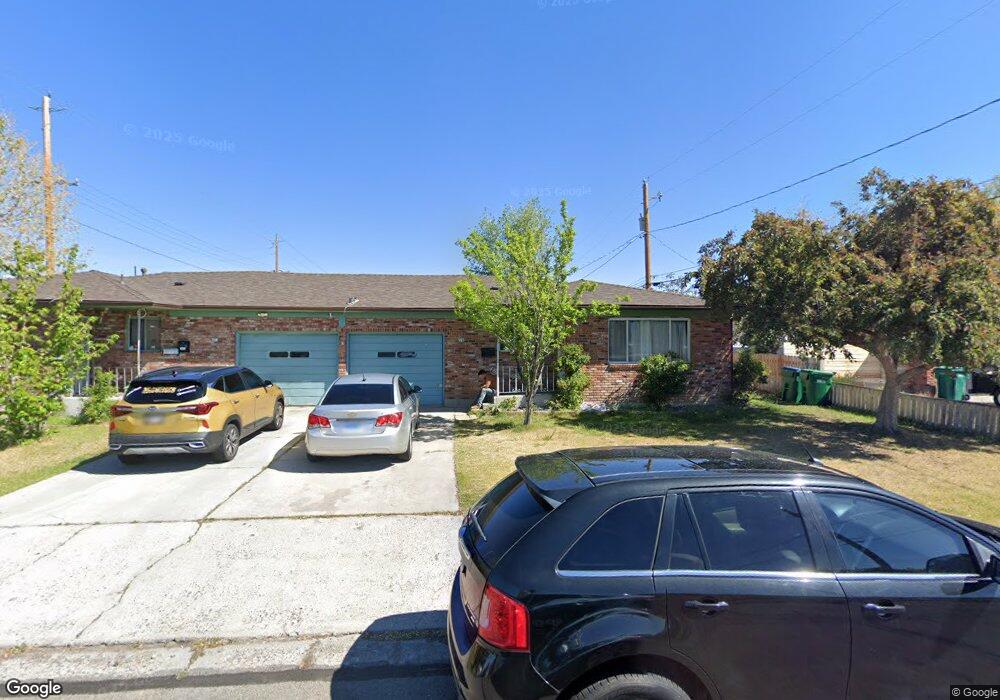
701 Thoma St Reno, NV 89502
Wells Avenue District NeighborhoodEstimated Value: $543,000 - $562,000
4
Beds
2
Baths
1,916
Sq Ft
$290/Sq Ft
Est. Value
About This Home
This home is located at 701 Thoma St, Reno, NV 89502 and is currently estimated at $555,665, approximately $290 per square foot. 701 Thoma St is a home located in Washoe County with nearby schools including Libby C Booth Elementary School, Vaughn Middle School, and Earl Wooster High School.
Ownership History
Date
Name
Owned For
Owner Type
Purchase Details
Closed on
Dec 23, 2020
Sold by
Burney Sajid Shamim and Sajid Najma
Bought by
Burney Sajid S and Sajid Najma
Current Estimated Value
Purchase Details
Closed on
Nov 21, 2001
Sold by
Ahsan Muhammad Anzar
Bought by
Burney Sajid Shamim and Sajid Najma
Home Financials for this Owner
Home Financials are based on the most recent Mortgage that was taken out on this home.
Original Mortgage
$160,050
Outstanding Balance
$62,140
Interest Rate
6.63%
Estimated Equity
$493,525
Purchase Details
Closed on
Jun 3, 1999
Sold by
Anzar Ahsan Pearl C and Anzar Ahsan Muhammad
Bought by
Ahsan Muhammad Anzar and Ahsan Pearl C
Home Financials for this Owner
Home Financials are based on the most recent Mortgage that was taken out on this home.
Original Mortgage
$119,250
Interest Rate
6.9%
Purchase Details
Closed on
Feb 28, 1997
Sold by
Ahsan Pearl C
Bought by
Ahsan Muhammad Anzar and Ahsan Pearl C
Create a Home Valuation Report for This Property
The Home Valuation Report is an in-depth analysis detailing your home's value as well as a comparison with similar homes in the area
Home Values in the Area
Average Home Value in this Area
Purchase History
| Date | Buyer | Sale Price | Title Company |
|---|---|---|---|
| Burney Sajid S | -- | None Available | |
| Burney Sajid Shamim | $165,000 | First Centennial Title Co | |
| Ahsan Muhammad Anzar | -- | Western Title Company Inc | |
| Ahsan Muhammad Anzar | -- | -- |
Source: Public Records
Mortgage History
| Date | Status | Borrower | Loan Amount |
|---|---|---|---|
| Open | Burney Sajid Shamim | $160,050 | |
| Previous Owner | Ahsan Muhammad Anzar | $119,250 |
Source: Public Records
Tax History Compared to Growth
Tax History
| Year | Tax Paid | Tax Assessment Tax Assessment Total Assessment is a certain percentage of the fair market value that is determined by local assessors to be the total taxable value of land and additions on the property. | Land | Improvement |
|---|---|---|---|---|
| 2025 | $1,151 | $82,239 | $55,195 | $27,044 |
| 2024 | $1,151 | $82,479 | $55,195 | $27,284 |
| 2023 | $1,117 | $81,071 | $57,505 | $23,566 |
| 2022 | $1,140 | $65,639 | $45,675 | $19,964 |
| 2021 | $1,059 | $51,048 | $31,465 | $19,583 |
| 2020 | $1,014 | $46,272 | $26,950 | $19,322 |
| 2019 | $970 | $44,131 | $25,690 | $18,441 |
| 2018 | $921 | $34,154 | $16,450 | $17,704 |
| 2017 | $897 | $33,711 | $16,450 | $17,261 |
| 2016 | $875 | $31,555 | $14,420 | $17,135 |
| 2015 | $243 | $27,695 | $10,430 | $17,265 |
| 2014 | $848 | $25,191 | $9,100 | $16,091 |
| 2013 | -- | $21,937 | $7,000 | $14,937 |
Source: Public Records
Map
Nearby Homes
- 660 Kirman Ave
- 660 Kirman Ave Unit 660/662
- 662 Kirman Ave
- 795 Thoma St
- 700 Thoma St
- 640 Kirman Ave
- 645 Edelweiss St
- 685 Thoma St Unit 2
- 685 Thoma St
- 780 Thoma St
- 790 Thoma St
- 655 Kirman Ave
- 720 Kirman Ave
- 800 Roberts St
- 701 Kirman Ave
- 645 Kirman Ave
- 840 Roberts St
- 727 Edelweiss St
- 615 Edelweiss St Unit A & B
- 615 Edelweiss St