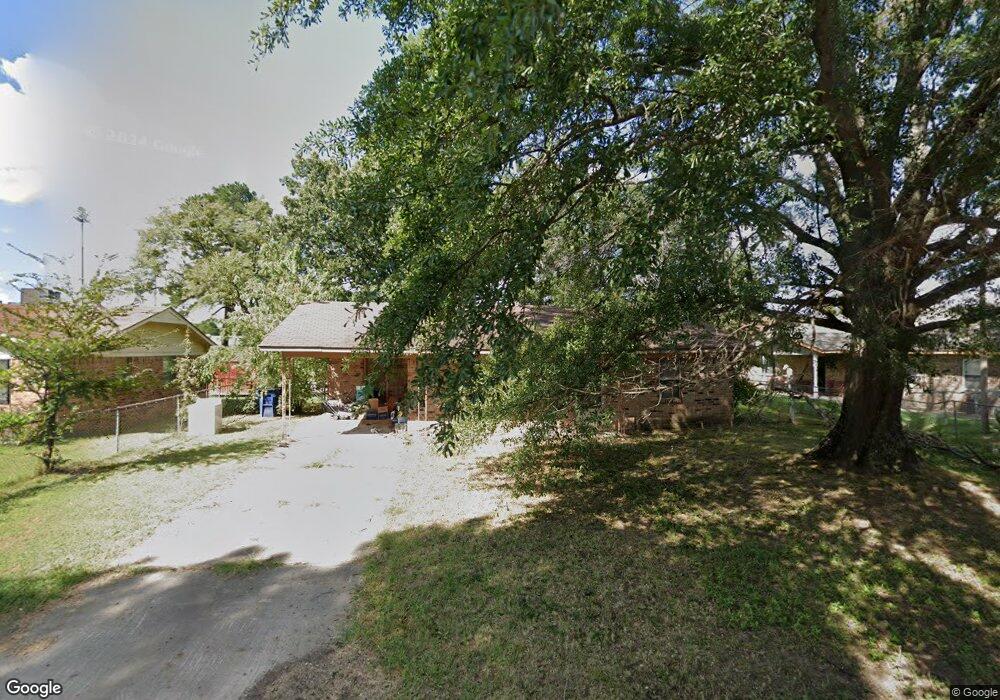
701 Varner Dr Muldrow, OK 74948
Estimated Value: $85,878 - $118,000
2
Beds
1
Bath
858
Sq Ft
$120/Sq Ft
Est. Value
About This Home
This home is located at 701 Varner Dr, Muldrow, OK 74948 and is currently estimated at $102,970, approximately $120 per square foot. 701 Varner Dr is a home located in Sequoyah County with nearby schools including Muldrow Elementary School, Muldrow Middle School, and Muldrow High School.
Ownership History
Date
Name
Owned For
Owner Type
Purchase Details
Closed on
Feb 17, 2012
Sold by
Duty Dolores K and Partain Lola F
Bought by
Partain Jennifer
Current Estimated Value
Home Financials for this Owner
Home Financials are based on the most recent Mortgage that was taken out on this home.
Original Mortgage
$41,734
Outstanding Balance
$28,467
Interest Rate
3.95%
Mortgage Type
New Conventional
Estimated Equity
$74,503
Purchase Details
Closed on
Feb 15, 2012
Sold by
Duty Dolores K and Keen Marie
Bought by
Duty Dolores K and Partain Lola F
Home Financials for this Owner
Home Financials are based on the most recent Mortgage that was taken out on this home.
Original Mortgage
$41,734
Outstanding Balance
$28,467
Interest Rate
3.95%
Mortgage Type
New Conventional
Estimated Equity
$74,503
Purchase Details
Closed on
Feb 14, 1994
Sold by
Rogers Donald J
Bought by
Keen Marie
Create a Home Valuation Report for This Property
The Home Valuation Report is an in-depth analysis detailing your home's value as well as a comparison with similar homes in the area
Home Values in the Area
Average Home Value in this Area
Purchase History
| Date | Buyer | Sale Price | Title Company |
|---|---|---|---|
| Partain Jennifer | $38,000 | None Available | |
| Duty Dolores K | -- | None Available | |
| Partain Jennifer | -- | None Available | |
| Partain Jennifer | -- | None Available | |
| Partain Jennifer | -- | None Available | |
| Keen Marie | $32,000 | -- |
Source: Public Records
Mortgage History
| Date | Status | Borrower | Loan Amount |
|---|---|---|---|
| Open | Partain Jennifer | $41,734 |
Source: Public Records
Tax History
| Year | Tax Paid | Tax Assessment Tax Assessment Total Assessment is a certain percentage of the fair market value that is determined by local assessors to be the total taxable value of land and additions on the property. | Land | Improvement |
|---|---|---|---|---|
| 2025 | $400 | $5,624 | $1,207 | $4,417 |
| 2024 | $400 | $5,356 | $1,100 | $4,256 |
| 2023 | $381 | $3,488 | $756 | $2,732 |
| 2022 | $106 | $3,488 | $787 | $2,701 |
| 2021 | $106 | $3,488 | $790 | $2,698 |
| 2020 | $106 | $3,488 | $812 | $2,676 |
| 2019 | $106 | $3,488 | $455 | $3,033 |
| 2018 | $106 | $3,488 | $455 | $3,033 |
| 2017 | $106 | $3,488 | $455 | $3,033 |
| 2016 | $106 | $3,488 | $455 | $3,033 |
| 2015 | $106 | $3,488 | $455 | $3,033 |
| 2014 | $106 | $3,488 | $455 | $3,033 |
Source: Public Records
Map
Nearby Homes
- 608 Varner Dr
- 700 SW 11th St
- 908 Cherry Loop
- 1312 S Caddo
- 201 9th St
- 806 S Ada St
- TBD Hugo St
- 701 S Ada St
- 416 Deer Run Rd
- 410 Deer Run Rd
- 107 7th St
- 302 E Shawntel Smith Blvd
- 1114 S Dogwood St
- TBD Treat Rd
- 103756 Oklahoma 64b
- 102 NW 2nd St
- 904 Short St
- 1923 Fisher Rd
- 701 E Shawntel Smith Blvd
- 472501 E 1127 Rd
Your Personal Tour Guide
Ask me questions while you tour the home.