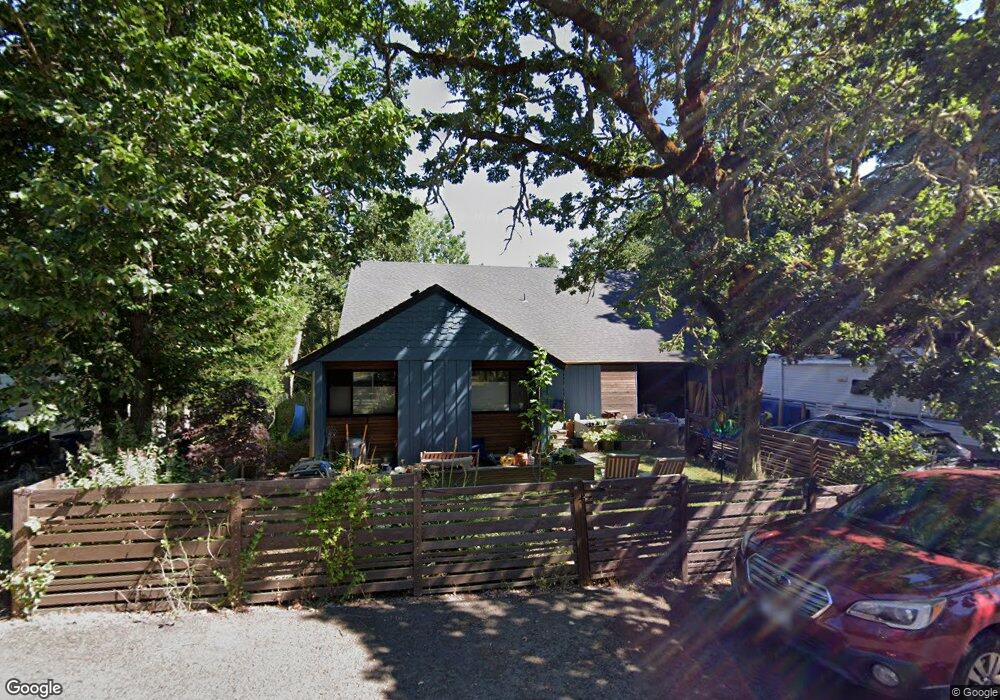
701 W 40th Ave Eugene, OR 97405
Crest Drive NeighborhoodEstimated Value: $787,000 - $960,000
4
Beds
4
Baths
3,557
Sq Ft
$241/Sq Ft
Est. Value
About This Home
This home is located at 701 W 40th Ave, Eugene, OR 97405 and is currently estimated at $855,695, approximately $240 per square foot. 701 W 40th Ave is a home located in Lane County with nearby schools including Edgewood Community Elementary School, Spencer Butte Middle School, and South Eugene High School.
Ownership History
Date
Name
Owned For
Owner Type
Purchase Details
Closed on
Nov 16, 2017
Sold by
Brunner Thomas Eric
Bought by
Brunner Thomas Eric
Current Estimated Value
Home Financials for this Owner
Home Financials are based on the most recent Mortgage that was taken out on this home.
Original Mortgage
$682,500
Outstanding Balance
$579,872
Interest Rate
4.48%
Mortgage Type
Reverse Mortgage Home Equity Conversion Mortgage
Estimated Equity
$275,823
Purchase Details
Closed on
Jun 26, 2017
Sold by
Williams Marybeth
Bought by
Brunner Thomas Eric
Purchase Details
Closed on
Dec 21, 2001
Sold by
Weeks Gertrude Ione Quarstein
Bought by
Green David Ipson and Green Jill Hoggard
Home Financials for this Owner
Home Financials are based on the most recent Mortgage that was taken out on this home.
Original Mortgage
$251,000
Interest Rate
6.51%
Create a Home Valuation Report for This Property
The Home Valuation Report is an in-depth analysis detailing your home's value as well as a comparison with similar homes in the area
Home Values in the Area
Average Home Value in this Area
Purchase History
| Date | Buyer | Sale Price | Title Company |
|---|---|---|---|
| Brunner Thomas Eric | -- | None Available | |
| Brunner Thomas Eric | -- | None Available | |
| Green David Ipson | $269,000 | Western Title & Escrow Compa |
Source: Public Records
Mortgage History
| Date | Status | Borrower | Loan Amount |
|---|---|---|---|
| Open | Brunner Thomas Eric | $682,500 | |
| Closed | Green David Ipson | $251,000 |
Source: Public Records
Tax History
| Year | Tax Paid | Tax Assessment Tax Assessment Total Assessment is a certain percentage of the fair market value that is determined by local assessors to be the total taxable value of land and additions on the property. | Land | Improvement |
|---|---|---|---|---|
| 2025 | $10,372 | $532,333 | -- | -- |
| 2024 | $10,243 | $516,829 | -- | -- |
| 2023 | $10,243 | $501,776 | $0 | $0 |
| 2022 | $9,596 | $487,162 | $0 | $0 |
| 2021 | $9,013 | $472,973 | $0 | $0 |
| 2020 | $8,812 | $459,198 | $0 | $0 |
| 2019 | $8,336 | $445,824 | $0 | $0 |
| 2018 | $7,873 | $420,232 | $0 | $0 |
| 2017 | $7,270 | $420,232 | $0 | $0 |
| 2016 | $7,011 | $407,992 | $0 | $0 |
| 2015 | $6,949 | $396,109 | $0 | $0 |
| 2014 | $6,987 | $384,572 | $0 | $0 |
Source: Public Records
Map
Nearby Homes
- 806 Sundance St
- 3854 Monroe St
- 320 Dellwood Dr
- 453 Dellwood Dr
- 3593 Lawrence St
- 357 W 37th Ave
- 0 Pine View Ct Unit 758820410
- 4040 Southpointe Dr
- 605 Fulvue Dr
- 0 Hidden Meadows
- 75 W 35th Place
- 653 Brookside Dr
- 278 Rockridge Ct
- 17 Westbrook Way
- 21 Westbrook Way
- 0 W 40th Ave Unit 3 545854116
- 0 W 40th Ave Unit 3 639571582
- 1 Storey Blvd
- 2 Storey Blvd
- 36 Westbrook Way
- 699 W 40th Ave
- 715 W 40th Ave
- 3944 Monroe St
- 695 W 40th Ave
- 725 W 40th Ave
- 3948 Monroe St
- 3936 Monroe St
- 735 W 40th Ave
- 585 W 40th Ave
- 3941 Monroe St
- 3930 Monroe St
- 640 W 40th Ave
- 3937 Monroe St
- 3949 Monroe St
- 3950 Monroe St
- 745 W 40th Ave
- 575 W 40th Ave
- 755 W 40th Ave
- 692 Deertrail Rd
- 3924 Monroe St
Your Personal Tour Guide
Ask me questions while you tour the home.