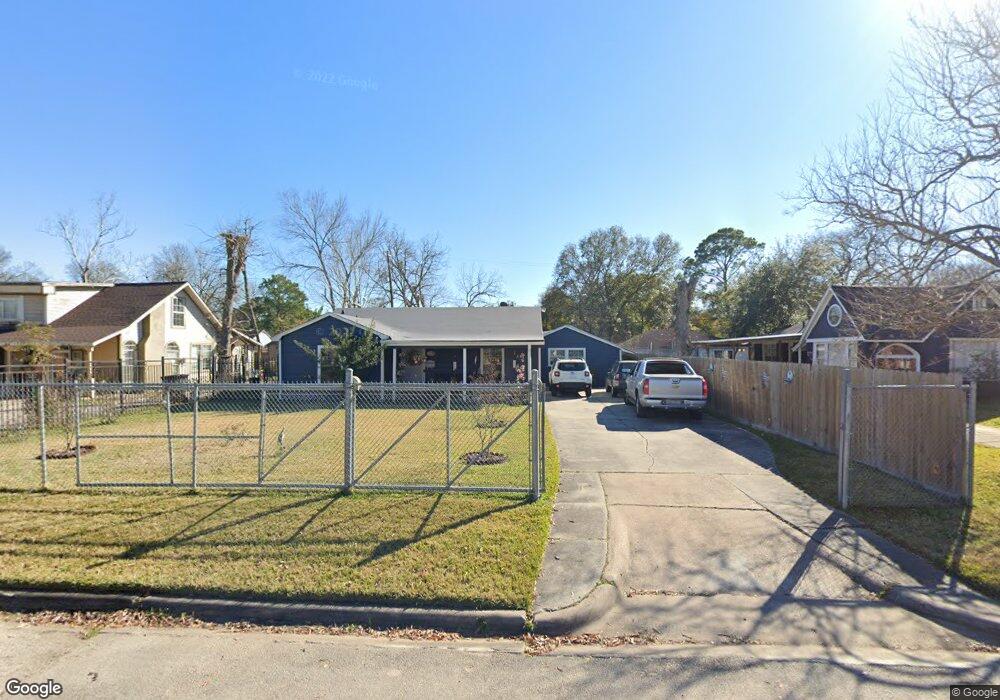
7010 Eppes St Houston, TX 77087
Golfcrest-Bellfort-Reveille NeighborhoodEstimated Value: $160,252 - $211,000
2
Beds
1
Bath
1,611
Sq Ft
$116/Sq Ft
Est. Value
About This Home
This home is located at 7010 Eppes St, Houston, TX 77087 and is currently estimated at $187,063, approximately $116 per square foot. 7010 Eppes St is a home located in Harris County with nearby schools including Golfcrest Elementary School, Hartman Middle School, and Ross Shaw Sterling Aviation High School.
Ownership History
Date
Name
Owned For
Owner Type
Purchase Details
Closed on
Jan 25, 2021
Sold by
Portillo Linda and Portillo Santos
Bought by
Portillo Linda
Current Estimated Value
Home Financials for this Owner
Home Financials are based on the most recent Mortgage that was taken out on this home.
Original Mortgage
$65,000
Outstanding Balance
$46,485
Interest Rate
2.67%
Mortgage Type
New Conventional
Estimated Equity
$140,578
Purchase Details
Closed on
Oct 5, 2007
Sold by
Portillo Napoleon J
Bought by
Portillo Santos
Purchase Details
Closed on
May 8, 1997
Sold by
Barbazette Etta Marie and Barbazette John Thomas
Bought by
Portillo Napoleon J and Portillo Santos E
Home Financials for this Owner
Home Financials are based on the most recent Mortgage that was taken out on this home.
Original Mortgage
$36,100
Interest Rate
7.97%
Create a Home Valuation Report for This Property
The Home Valuation Report is an in-depth analysis detailing your home's value as well as a comparison with similar homes in the area
Home Values in the Area
Average Home Value in this Area
Purchase History
| Date | Buyer | Sale Price | Title Company |
|---|---|---|---|
| Portillo Linda | -- | None Listed On Document | |
| Portillo Santos | -- | None Available | |
| Portillo Napoleon J | -- | Stewart Title |
Source: Public Records
Mortgage History
| Date | Status | Borrower | Loan Amount |
|---|---|---|---|
| Open | Portillo Linda | $65,000 | |
| Previous Owner | Portillo Napoleon J | $36,100 |
Source: Public Records
Tax History
| Year | Tax Paid | Tax Assessment Tax Assessment Total Assessment is a certain percentage of the fair market value that is determined by local assessors to be the total taxable value of land and additions on the property. | Land | Improvement |
|---|---|---|---|---|
| 2025 | $1,020 | $127,408 | $69,713 | $57,695 |
| 2024 | $1,020 | $142,983 | $59,150 | $83,833 |
| 2023 | $1,020 | $142,983 | $59,150 | $83,833 |
| 2022 | $1,891 | $121,483 | $59,150 | $62,333 |
| 2021 | $1,819 | $117,679 | $29,575 | $88,104 |
| 2020 | $1,719 | $77,691 | $25,350 | $52,341 |
| 2019 | $1,633 | $64,517 | $25,350 | $39,167 |
| 2018 | $1,011 | $64,517 | $25,350 | $39,167 |
| 2017 | $1,631 | $64,517 | $25,350 | $39,167 |
| 2016 | $1,631 | $64,517 | $25,350 | $39,167 |
| 2015 | $1,106 | $62,182 | $25,350 | $36,832 |
| 2014 | $1,106 | $62,182 | $25,350 | $36,832 |
Source: Public Records
Map
Nearby Homes
- 3408 Chaffin St
- 5209 Plum Dr
- 7184 Moline St
- 5707 Waltrip St
- 7309 Moline St
- 3147 Golfcrest Blvd
- 7326 Thurow St
- 3135 Golfcrest Blvd
- 7393 Fairway Dr Unit B
- 4004 Weslow St
- 7310 Arnim St
- 6723 South Loop E Unit 9
- 7418 Thurow St
- 7422 Thurow St
- 7435 Briefway St
- 7507 Greenstone St
- 7042 Plum Creek Terrace Ln
- 6004 Bois d Arc St
- 7341 Oak Hill Dr
- 7022 Plum Creek Trail Ln
Your Personal Tour Guide
Ask me questions while you tour the home.