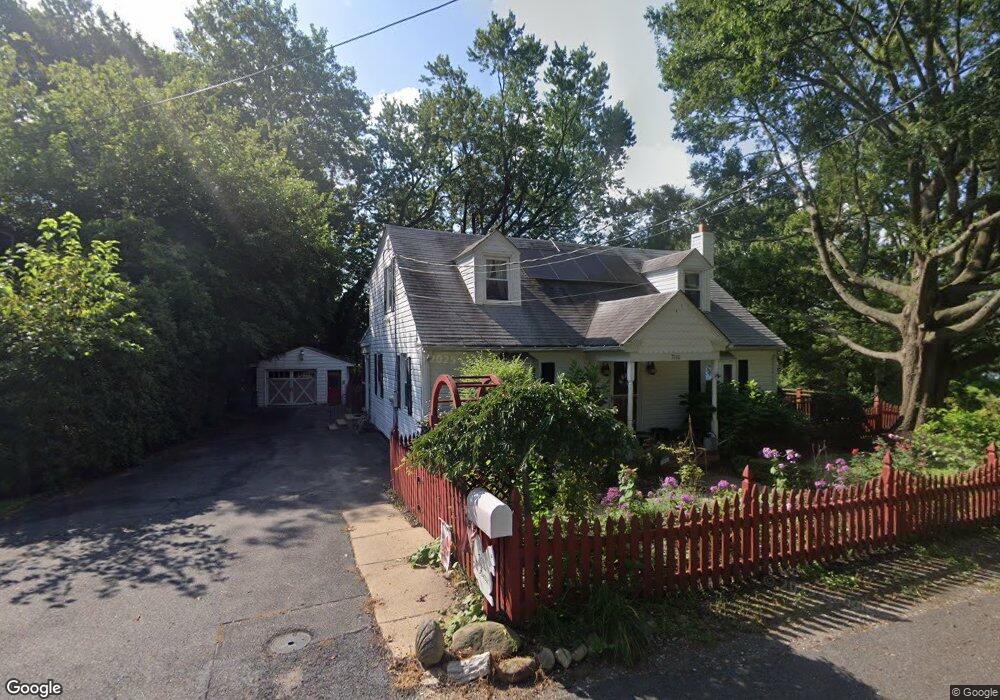
7010S Second Ave Queenstown, MD 21658
Estimated Value: $425,000 - $567,000
--
Bed
2
Baths
1,438
Sq Ft
$365/Sq Ft
Est. Value
About This Home
This home is located at 7010S Second Ave, Queenstown, MD 21658 and is currently estimated at $524,560, approximately $364 per square foot. 7010S Second Ave is a home located in Queen Anne's County with nearby schools including Kennard Elementary School, Centreville Middle School, and Queen Anne's County High School.
Ownership History
Date
Name
Owned For
Owner Type
Purchase Details
Closed on
Sep 23, 2013
Sold by
Marzucco John P and Marzucco Mary M
Bought by
Powell Michael C and Powell Barbara A
Current Estimated Value
Home Financials for this Owner
Home Financials are based on the most recent Mortgage that was taken out on this home.
Original Mortgage
$316,000
Outstanding Balance
$81,728
Interest Rate
4.61%
Mortgage Type
New Conventional
Estimated Equity
$442,832
Purchase Details
Closed on
Feb 14, 2003
Sold by
Marzucco John P and Marzucco Mary M
Bought by
Marzucco John P and Marzucco Mary M
Purchase Details
Closed on
Feb 12, 1998
Sold by
Marzucco John P
Bought by
Marzucco John P and Marzucco Mary M
Purchase Details
Closed on
Jun 5, 1995
Sold by
Radcliffe Edmund M and Radcliffe Alexander H
Bought by
Marzucco John P
Create a Home Valuation Report for This Property
The Home Valuation Report is an in-depth analysis detailing your home's value as well as a comparison with similar homes in the area
Home Values in the Area
Average Home Value in this Area
Purchase History
| Date | Buyer | Sale Price | Title Company |
|---|---|---|---|
| Powell Michael C | $395,000 | Advantage Title Company | |
| Marzucco John P | -- | -- | |
| Marzucco John P | -- | -- | |
| Marzucco John P | $111,500 | -- |
Source: Public Records
Mortgage History
| Date | Status | Borrower | Loan Amount |
|---|---|---|---|
| Open | Powell Michael C | $316,000 | |
| Closed | Marzucco John P | -- |
Source: Public Records
Tax History Compared to Growth
Tax History
| Year | Tax Paid | Tax Assessment Tax Assessment Total Assessment is a certain percentage of the fair market value that is determined by local assessors to be the total taxable value of land and additions on the property. | Land | Improvement |
|---|---|---|---|---|
| 2025 | $5,119 | $440,467 | $0 | $0 |
| 2024 | $4,870 | $415,100 | $260,400 | $154,700 |
| 2023 | $4,711 | $401,567 | $0 | $0 |
| 2022 | $4,154 | $388,033 | $0 | $0 |
| 2021 | $0 | $374,500 | $192,800 | $181,700 |
| 2020 | $0 | $370,467 | $0 | $0 |
| 2019 | $4,178 | $366,433 | $0 | $0 |
| 2018 | $4,101 | $362,400 | $192,800 | $169,600 |
| 2017 | $3,105 | $317,367 | $0 | $0 |
| 2016 | -- | $272,333 | $0 | $0 |
| 2015 | $1,124 | $227,300 | $0 | $0 |
| 2014 | $1,124 | $227,300 | $0 | $0 |
Source: Public Records
Map
Nearby Homes
- 6915 Main St
- 100 Wall St
- 108 Wall St
- 7204 Main St
- 128 Aker Rd
- 0 U S 301
- 248 Harbor Ln
- 108 Carriage Ln
- 315 Nottingham Ln
- 103 Trevors Ct
- 213 Slippery Hill Ln
- 915 Sportsman Neck Rd
- 0 Hess Frontage Rd
- 149 Unit 141155 SAWMILL Lane
- 201 Sawmill Ln
- 141 Sawmill Ln
- 227 Homeport Dr
- 149 Sawmill Ln
- 155 Sawmill Ln
- 149,141,155 Sawmill Ln
- 7010 2nd Ave
- 7010S 2nd Ave
- 7010 Second Ave
- 7016 Second Ave
- 6906 Second Ave
- 7020 Second Ave
- 7024S Second Ave
- 7024S 2nd Ave
- 7024 S S 2nd Ave
- 7024 S 2nd Ave S
- 7024 Second Ave
- 101N Davidson Ave
- 121 Charity Ln
- 101 Davidson Ave
- 100 Davidson Ave
- 7100 First Ave
- 111 Charity Ln
- 7102S Second Ave
- 116 Charity Ln
- 7102 Second Ave