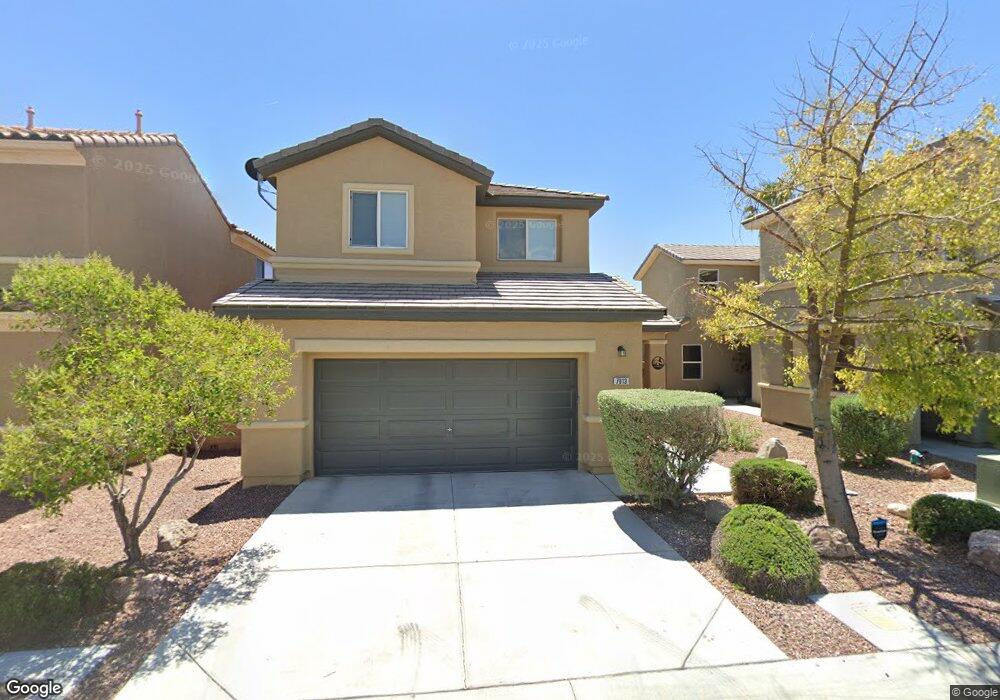
7013 Mercurio Ave Las Vegas, NV 89131
Tule Springs NeighborhoodEstimated Value: $410,361 - $441,000
3
Beds
3
Baths
1,669
Sq Ft
$254/Sq Ft
Est. Value
About This Home
This home is located at 7013 Mercurio Ave, Las Vegas, NV 89131 and is currently estimated at $424,090, approximately $254 per square foot. 7013 Mercurio Ave is a home located in Clark County with nearby schools including Thomas O'Roarke Elementary School, Ralph Cadwallader Middle School, and Arbor View High School.
Ownership History
Date
Name
Owned For
Owner Type
Purchase Details
Closed on
Oct 24, 2011
Sold by
Empire Investment Fund Llc
Bought by
Johnson Hal C and Johnson Weenona A
Current Estimated Value
Purchase Details
Closed on
Mar 28, 2011
Sold by
Lighten Trevor J
Bought by
Empire Investment Fund Llc
Purchase Details
Closed on
Mar 14, 2005
Sold by
Lighten Kasey L
Bought by
Lighten Trevor J
Home Financials for this Owner
Home Financials are based on the most recent Mortgage that was taken out on this home.
Original Mortgage
$224,000
Interest Rate
4.87%
Mortgage Type
New Conventional
Purchase Details
Closed on
Mar 10, 2005
Sold by
Pn Ii Inc
Bought by
Lighten Trevor J
Home Financials for this Owner
Home Financials are based on the most recent Mortgage that was taken out on this home.
Original Mortgage
$224,000
Interest Rate
4.87%
Mortgage Type
New Conventional
Create a Home Valuation Report for This Property
The Home Valuation Report is an in-depth analysis detailing your home's value as well as a comparison with similar homes in the area
Home Values in the Area
Average Home Value in this Area
Purchase History
| Date | Buyer | Sale Price | Title Company |
|---|---|---|---|
| Johnson Hal C | $125,000 | First American Title Paseo | |
| Empire Investment Fund Llc | $99,500 | None Available | |
| Lighten Trevor J | -- | Lawyers Title Of Nevada | |
| Lighten Trevor J | $280,000 | Lawyers Title Of Nevada |
Source: Public Records
Mortgage History
| Date | Status | Borrower | Loan Amount |
|---|---|---|---|
| Previous Owner | Lighten Trevor J | $224,000 | |
| Closed | Lighten Trevor J | $42,000 |
Source: Public Records
Tax History Compared to Growth
Tax History
| Year | Tax Paid | Tax Assessment Tax Assessment Total Assessment is a certain percentage of the fair market value that is determined by local assessors to be the total taxable value of land and additions on the property. | Land | Improvement |
|---|---|---|---|---|
| 2025 | $1,858 | $108,400 | $30,450 | $77,950 |
| 2024 | $1,804 | $108,400 | $30,450 | $77,950 |
| 2023 | $1,804 | $105,240 | $31,850 | $73,390 |
| 2022 | $1,752 | $95,458 | $28,350 | $67,108 |
| 2021 | $1,701 | $86,945 | $23,100 | $63,845 |
| 2020 | $1,648 | $86,159 | $23,100 | $63,059 |
| 2019 | $1,600 | $82,198 | $20,300 | $61,898 |
| 2018 | $1,554 | $76,521 | $17,150 | $59,371 |
| 2017 | $2,134 | $65,100 | $14,000 | $51,100 |
| 2016 | $1,470 | $57,973 | $11,900 | $46,073 |
| 2015 | $1,466 | $51,758 | $8,750 | $43,008 |
| 2014 | $1,424 | $42,132 | $8,750 | $33,382 |
Source: Public Records
Map
Nearby Homes
- 7105 Mercurio Ave
- 8129 Bay Colony St
- 8113 Loma Del Ray St
- 7250 Orchard Harvest Ave
- 7230 Fresh Harvest Ave
- 7301 Fruitful Harvest Ave
- 7245 Golden Rock Ct
- 7265 Golden Rock Ct
- 7275 Golden Rock Ct
- 7250 Golden Rock Ct
- 7255 Golden Rock Ct
- 7235 Golden Rock Ct
- 7240 Golden Rock Ct
- 7230 Golden Rock Ct
- 8084 Celina Hills St
- 8205 Celina Hills St
- 8236 Imperial Lakes St
- 8241 Celina Hills St
- 8316 Imperial Lakes St
- 7220 Fairwind Acres Place
- 7021 Mercurio Ave
- 7016 Mercurio Ave
- 7008 Mercurio Ave
- 7020 Mercurio Ave
- 8012 Pasadera St
- 8016 Pasadera St
- 7024 Mercurio Ave
- 8020 Pasadera St
- 0 Grand Teton Dr
- 6144 Grand Teton Dr
- 7100 Mercurio Ave
- 7013 River Meadows Ave
- 7009 River Meadows Ave
- 7017 River Meadows Ave
- 7017 River Meadows Ave Unit n/a
- 8024 Pasadera St
- 7021 River Meadows Ave
- 7025 River Meadows Ave
- 7104 Mercurio Ave